
August 07, 2025 a 12:32 pm


Bonds - Performance Analysis
The bond market is a dynamic and essential component of the global financial landscape. This report provides a detailed analysis of bond performance over various periods, highlighting top performers, trends, and underperformers. By examining 1-week, 1-month, and 3-month timelines, investors can gain insights into potential investment strategies and market movements. Analyzing these periods offers a snapshot of market sentiment and economic conditions influencing bond yields and prices.
📊 Bonds Performance One Week
| Bond | Performance (%) | Performance |
|---|---|---|
| 20+ Year Treasury Bond ETF | 1.04 | |
| 10-20 Year Treasury Bond ETF | 0.94 | |
| 7-10 Year Treasury Bond ETF | 0.82 | |
| 3-7 Year Treasury Bond ETF | 0.59 | |
| TIPS Bond ETF | 0.58 | |
| 1-3 Year Treasury Bond ETF | 0.19 | |
| High Yield Corporate Bond ETF | -0.11 |
🗓️ Bonds Performance One Month
| Bond | Performance (%) | Performance |
|---|---|---|
| 20+ Year Treasury Bond ETF | 2.12 | |
| 10-20 Year Treasury Bond ETF | 2.04 | |
| 7-10 Year Treasury Bond ETF | 1.46 | |
| TIPS Bond ETF | 1.08 | |
| 3-7 Year Treasury Bond ETF | 0.96 | |
| High Yield Corporate Bond ETF | 0.38 | |
| 1-3 Year Treasury Bond ETF | 0.32 |
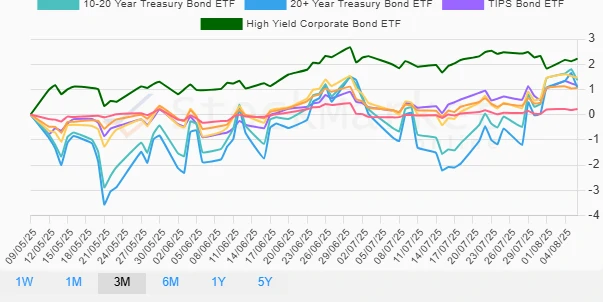
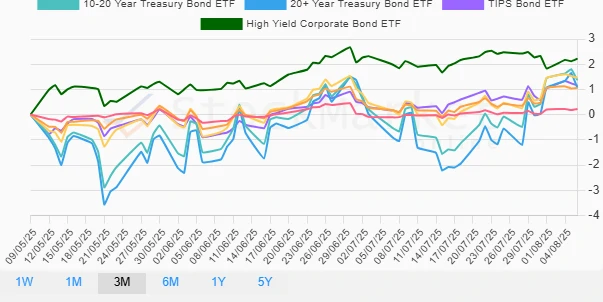
📅 Bonds Performance Three Months
| Bond | Performance (%) | Performance |
|---|---|---|
| High Yield Corporate Bond ETF | 2.22 | |
| 7-10 Year Treasury Bond ETF | 1.46 | |
| 10-20 Year Treasury Bond ETF | 1.37 | |
| TIPS Bond ETF | 1.16 | |
| 3-7 Year Treasury Bond ETF | 1.06 | |
| 20+ Year Treasury Bond ETF | 1.07 | |
| 1-3 Year Treasury Bond ETF | 0.22 |
🔍 Summary
Observing the bond performances over different periods reveals key insights. Over the 1-week and 1-month periods, longer-duration bonds such as the 20+ Year Treasury Bond ETF have shown significant positive performance. Conversely, the High Yield Corporate Bond ETF experienced a setback in the 1-week timeline but emerged as the leader in the 3-month analysis. The fluctuating performances emphasize the importance of diversifying investment across various bond types and maturities to mitigate risks and capture potential gains. Investors should consider economic signals and policy changes to position effectively in this dynamic market.
Smart Data Insight
Master the Perfect Entry & Exit for this Stock
Don't leave your profits to chance. Historically, this stock follows specific seasonal patterns that institutional traders use to maximize returns.
- ✅ Identify the "Golden Buying Window"
- ✅ Avoid high-risk correction cycles
- ✅ Backtested data from the last 20+ years