
August 06, 2026 a 12:32 pm


Bonds - Performance Analysis
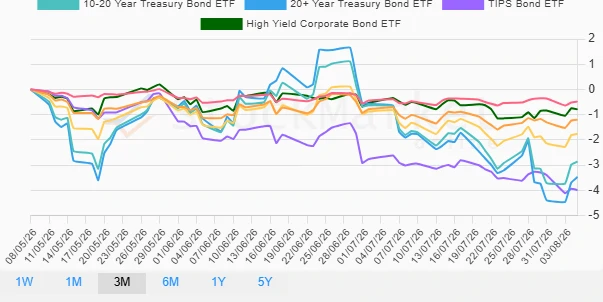
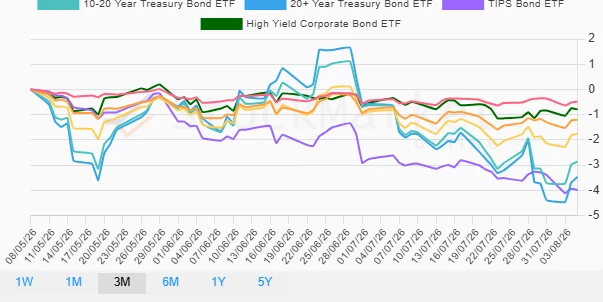
📊 The bond market has exhibited varied performances across different timeframes. Over the past week, treasury bonds showed mixed signals with a modest growth in the 10-20 and 20+ year categories. The past month, however, witnessed an overall decline, most notably in longer-term treasuries. The three months' data presented a more pronounced downward trend, highlighting significant stress in the bond sector, particularly within TIPS and long-term treasuries.
Bonds Performance One Week
| Bond | Performance (%) | Performance |
|---|---|---|
| 10-20 Year Treasury Bond ETF | 0.28 | |
| 20+ Year Treasury Bond ETF | 0.26 | |
| 7-10 Year Treasury Bond ETF | 0.10 | |
| High Yield Corporate Bond ETF | 0.06 | |
| 3-7 Year Treasury Bond ETF | -0.03 | |
| 1-3 Year Treasury Bond ETF | -0.13 | |
| TIPS Bond ETF | -0.69 |
Bonds Performance One Month
| Bond | Performance (%) | Performance |
|---|---|---|
| 1-3 Year Treasury Bond ETF | 0.06 | |
| 3-7 Year Treasury Bond ETF | -0.18 | |
| High Yield Corporate Bond ETF | -0.31 | |
| 7-10 Year Treasury Bond ETF | -0.43 | |
| TIPS Bond ETF | -1.08 | |
| 10-20 Year Treasury Bond ETF | -1.31 | |
| 20+ Year Treasury Bond ETF | -1.79 |
Bonds Performance Three Months
| Bond | Performance (%) | Performance |
|---|---|---|
| 1-3 Year Treasury Bond ETF | -0.48 | |
| High Yield Corporate Bond ETF | -0.79 | |
| 3-7 Year Treasury Bond ETF | -1.20 | |
| 7-10 Year Treasury Bond ETF | -1.76 | |
| 10-20 Year Treasury Bond ETF | -2.87 | |
| 20+ Year Treasury Bond ETF | -3.48 | |
| TIPS Bond ETF | -3.99 |
Summary
💡 The recent analysis of bond performance highlights notable challenges across the treasury spectrum, particularly in the context of long-term securities. While short-term analysis shows some resilience, the comprehensive three-month trend is predominantly bearish, with TIPS and extended duration bonds under significant pressure. Investors should brace for potential volatility ahead, keeping a close watch on inflation indicators as they impact Treasury Inflation-Protected Securities and bond yields overall. A cautious approach with a diversification strategy might serve well to mitigate potential downside risks in the current environment.
Smart Data Insight
Master the Perfect Entry & Exit for this Stock
Don't leave your profits to chance. Historically, this stock follows specific seasonal patterns that institutional traders use to maximize returns.
- ✅ Identify the "Golden Buying Window"
- ✅ Avoid high-risk correction cycles
- ✅ Backtested data from the last 20+ years