
November 05, 2026 a 12:32 pm


Bonds - Performance Analysis
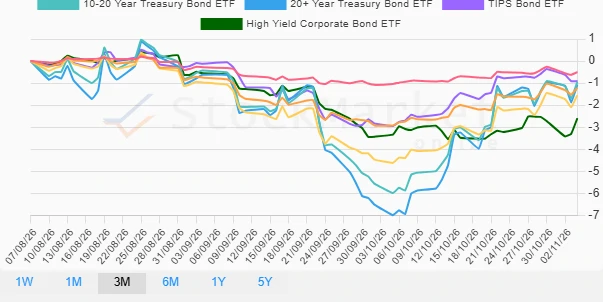
Analyzing the bond market's recent performance highlights the volatility and diverse returns across various bond categories. The short-term and long-term bond performance over the last three months has shown mixed trends, with certain categories outperforming while others suffered. This assessment provides insight into the current bond market dynamics and what investors can anticipate moving forward.
📊 Bonds Performance One Week
| Bond | Performance (%) | Performance |
|---|---|---|
| 7-10 Year Treasury Bond ETF | 0.46% | |
| 10-20 Year Treasury Bond ETF | 0.43% | |
| 20+ Year Treasury Bond ETF | 0.34% | |
| 3-7 Year Treasury Bond ETF | 0.21% | |
| 1-3 Year Treasury Bond ETF | -0.09% | |
| High Yield Corporate Bond ETF | -0.07% | |
| TIPS Bond ETF | -0.32% |
📊 Bonds Performance One Month
| Bond | Performance (%) | Performance |
|---|---|---|
| 20+ Year Treasury Bond ETF | 5.69% | |
| 10-20 Year Treasury Bond ETF | 4.80% | |
| 7-10 Year Treasury Bond ETF | 2.83% | |
| TIPS Bond ETF | 1.85% | |
| 3-7 Year Treasury Bond ETF | 1.56% | |
| 1-3 Year Treasury Bond ETF | 0.48% | |
| High Yield Corporate Bond ETF | 0.36% |
📊 Bonds Performance Three Months
| Bond | Performance (%) | Performance |
|---|---|---|
| High Yield Corporate Bond ETF | -2.60% | |
| 7-10 Year Treasury Bond ETF | -1.55% | |
| 3-7 Year Treasury Bond ETF | -1.22% | |
| 20+ Year Treasury Bond ETF | -1.08% | |
| 10-20 Year Treasury Bond ETF | -0.95% | |
| TIPS Bond ETF | -0.91% | |
| 1-3 Year Treasury Bond ETF | -0.50% |
💡 Summary
The bond market over the past three weeks has exhibited significant variability across different bond types, with longer-duration bonds generally outperforming their shorter-duration counterparts. The short-term gains seen over the one-month period illustrate strong investor confidence in long-dated bonds, possibly driven by low-interest rates or inflation hedging strategies. However, the three-month view reflects the challenges posed by economic uncertainties, with most bonds experiencing negative returns.
In conclusion, while challenging times persist for fixed-income markets, investors should remain vigilant of interest rate trends and macroeconomic signals to optimize portfolio allocations.
Smart Data Insight
Master the Perfect Entry & Exit for this Stock
Don't leave your profits to chance. Historically, this stock follows specific seasonal patterns that institutional traders use to maximize returns.
- ✅ Identify the "Golden Buying Window"
- ✅ Avoid high-risk correction cycles
- ✅ Backtested data from the last 20+ years