February 05, 2026 a 12:32 pm


Bonds - Performance Analysis
📊 This analysis covers the recent performance trends in various bond ETFs over differing periods. It identifies key performers and laggards in the market, helping investors to form insights into the driving forces behind current bond movements.
Bonds Performance One Week
📈 Over the past week, the bond market has predominantly seen negative performance. The "20+ Year Treasury Bond ETF" registered the largest decline, indicating potential pessimism over long-duration bonds amidst rising interest rate expectations. Shorter-duration bonds witnessed relatively smaller declines.
| Bond | Performance (%) | Performance |
|---|---|---|
| 1-3 Year Treasury Bond ETF | -0.23 | |
| 3-7 Year Treasury Bond ETF | -0.34 | |
| 7-10 Year Treasury Bond ETF | -0.51 | |
| 10-20 Year Treasury Bond ETF | -0.89 | |
| 20+ Year Treasury Bond ETF | -1.24 | |
| TIPS Bond ETF | -0.25 | |
| High Yield Corporate Bond ETF | -0.50 |
Bonds Performance One Month
📉 Over the past month, the bond market has also mostly witnessed declines but the "TIPS Bond ETF" showed a positive performance, suggesting that inflation expectations might be priced in. The "7-10 Year Treasury Bond ETF" continued to experience negative pressure.
| Bond | Performance (%) | Performance |
|---|---|---|
| 1-3 Year Treasury Bond ETF | -0.21 | |
| 3-7 Year Treasury Bond ETF | -0.53 | |
| 7-10 Year Treasury Bond ETF | -0.81 | |
| 10-20 Year Treasury Bond ETF | -0.84 | |
| 20+ Year Treasury Bond ETF | -0.84 | |
| TIPS Bond ETF | 0.16 | |
| High Yield Corporate Bond ETF | -0.34 |
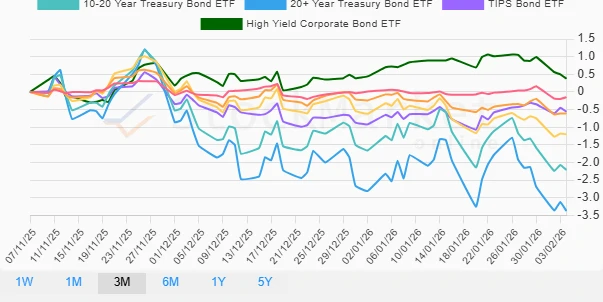
Bonds Performance Three Months
☁️ Over the last three months, downward pressure has been pronounced, especially for long-term maturities. The "High Yield Corporate Bond ETF" has surprisingly bucked the trend with a gain, reflecting perhaps some risk-on sentiment among investors.
| Bond | Performance (%) | Performance |
|---|---|---|
| 1-3 Year Treasury Bond ETF | -0.15 | |
| 3-7 Year Treasury Bond ETF | -0.61 | |
| 7-10 Year Treasury Bond ETF | -1.20 | |
| 10-20 Year Treasury Bond ETF | -2.21 | |
| 20+ Year Treasury Bond ETF | -3.37 | |
| TIPS Bond ETF | -0.56 | |
| High Yield Corporate Bond ETF | 0.38 |
Summary
✅ In summary, the bond market performance over the analyzed periods points to a tangible bearish sentiment across most government bonds, especially for longer durations. This trend may be linked to inflation fears and potential interest rate hikes. The exception to this is found in the High Yield Corporate Bond ETF, which posted modest gains over the three-month period, suggesting some appetite for riskier assets could be emerging. Investors might consider shorter duration bonds or inflation-protected securities to mitigate risks associated with interest rate volatility.
Smart Data Insight
Master the Perfect Entry & Exit for this Stock
Don't leave your profits to chance. Historically, this stock follows specific seasonal patterns that institutional traders use to maximize returns.
- ✅ Identify the "Golden Buying Window"
- ✅ Avoid high-risk correction cycles
- ✅ Backtested data from the last 20+ years