September 04, 2025 a 12:31 pm


Bonds - Performance Analysis
In the fluctuating landscape of bond markets, analyzing recent performance trends is paramount for making informed investment decisions. This analysis delves into the short-term trends of various bond categories over the past week, month, and quarter. The data presented will highlight top-performing bonds, identify underperformers, and unveil emerging trends that may influence strategic positioning in bond portfolios.
📊 Bonds Performance One Week
During the past week, all observed bond categories experienced negative returns, signaling a weak performance across the market. The longest maturity bonds, such as the 20+ Year Treasury Bond ETF, showed the most significant declines. Shorter-term bonds such as the 1-3 Year Treasury Bond ETF were less impacted but still reported negative performance.
| Bond | Performance (%) | Performance |
|---|---|---|
| 1-3 Year Treasury Bond ETF | -0.21% | |
| 3-7 Year Treasury Bond ETF | -0.22% | |
| 7-10 Year Treasury Bond ETF | -0.35% | |
| TIPS Bond ETF | -0.44% | |
| High Yield Corporate Bond ETF | -0.50% | |
| 10-20 Year Treasury Bond ETF | -0.58% | |
| 20+ Year Treasury Bond ETF | -0.73% |
🔍 Bonds Performance One Month
Over the past month, there were diverging trends with opportunities for gains in some bonds while longer-term Treasury Bonds struggled. The High Yield Corporate Bond ETF showed relative strength, outperforming its peers, whereas the 20+ Year Treasury Bond ETF suffered notable losses.
| Bond | Performance (%) | Performance |
|---|---|---|
| High Yield Corporate Bond ETF | 0.48% | |
| TIPS Bond ETF | 0.38% | |
| 3-7 Year Treasury Bond ETF | 0.31% | |
| 7-10 Year Treasury Bond ETF | 0.19% | |
| 1-3 Year Treasury Bond ETF | 0.10% | |
| 10-20 Year Treasury Bond ETF | -1.12% | |
| 20+ Year Treasury Bond ETF | -1.98% |
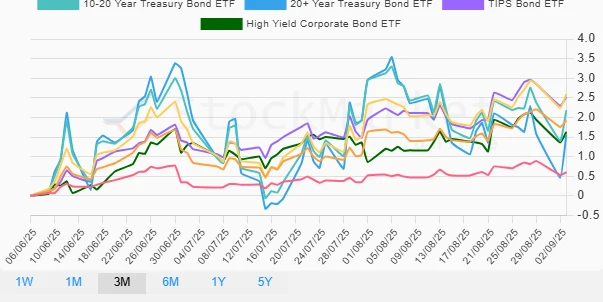
📈 Bonds Performance Three Months
An analysis of the last quarter shows a favorable atmosphere for most bonds with TIPS and mid-duration Treasuries like the 7-10 Year Treasury Bond ETF leading the pack. However, the longest-dated bonds still struggled to keep pace with their mid to shorter-term counterparts.
| Bond | Performance (%) | Performance |
|---|---|---|
| 7-10 Year Treasury Bond ETF | 2.59% | |
| TIPS Bond ETF | 2.52% | |
| 10-20 Year Treasury Bond ETF | 2.18% | |
| High Yield Corporate Bond ETF | 1.63% | |
| 3-7 Year Treasury Bond ETF | 1.92% | |
| 1-3 Year Treasury Bond ETF | 0.60% | |
| 20+ Year Treasury Bond ETF | 1.56% |
💡 Summary
The bond market has exhibited volatility with distinct performance patterns over recent periods. While shorter-term and inflation-protected bonds (TIPS) have demonstrated resilience, longer-term bonds continue to face headwinds, as evidenced by lower performances across these periods. Given these trends, investors might consider maintaining a diversified approach with a focus on mid-duration and inflation-protected securities, which have shown potential to navigate recent market dynamics effectively.
Smart Data Insight
Master the Perfect Entry & Exit for this Stock
Don't leave your profits to chance. Historically, this stock follows specific seasonal patterns that institutional traders use to maximize returns.
- ✅ Identify the "Golden Buying Window"
- ✅ Avoid high-risk correction cycles
- ✅ Backtested data from the last 20+ years