
September 03, 2026 a 12:31 pmH1>Bonds - Performance Analysis


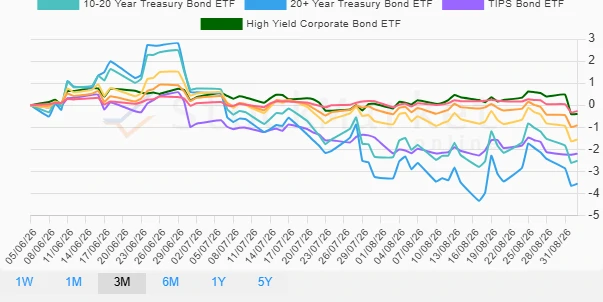
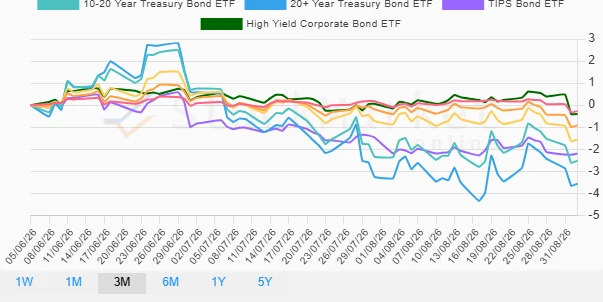
This analysis provides an in-depth examination of bonds' performance over different time horizons: one week, one month, and three months. Observing such data is crucial for investors looking to understand macroeconomic trends and potential market shifts. Utilizing the presented data offers insights into both opportunities and pitfalls in bond investments.
📊 Bonds Performance One Week
In the past week, the bond market displays a consistent downward trend across various instruments. The 20+ Year Treasury Bond ETF exhibits the steepest decline, indicative of diminishing long-term yield expectations.
| Bond | Performance (%) | Performance |
|---|---|---|
| 1-3 Year Treasury Bond ETF | -0.49% | |
| TIPS Bond ETF | -0.54% | |
| 3-7 Year Treasury Bond ETF | -0.83% | |
| High Yield Corporate Bond ETF | -0.95% | |
| 7-10 Year Treasury Bond ETF | -1.13% | |
| 10-20 Year Treasury Bond ETF | -1.32% | |
| 20+ Year Treasury Bond ETF | -1.42% |
📊 Bonds Performance One Month
Over the past month, the TIPS Bond ETF demonstrates resilience, posting the smallest negative return among peers. Meanwhile, longer-term bonds continue to experience pressure, reflecting risk-averse sentiment.
| Bond | Performance (%) | Performance |
|---|---|---|
| TIPS Bond ETF | -0.19% | |
| 1-3 Year Treasury Bond ETF | -0.29% | |
| High Yield Corporate Bond ETF | -0.55% | |
| 10-20 Year Treasury Bond ETF | -0.91% | |
| 3-7 Year Treasury Bond ETF | -0.79% | |
| 20+ Year Treasury Bond ETF | -1.01% | |
| 7-10 Year Treasury Bond ETF | -1.14% |
📊 Bonds Performance Three Months
The three-month period showcases a definitive drop in longer-duration bonds, with the 20+ Year Treasury Bond ETF declining the most. This downturn underscores market apprehensions about future interest rate trajectories.
| Bond | Performance (%) | Performance |
|---|---|---|
| 1-3 Year Treasury Bond ETF | -0.27% | |
| High Yield Corporate Bond ETF | -0.40% | |
| 3-7 Year Treasury Bond ETF | -0.91% | |
| TIPS Bond ETF | -2.20% | |
| 7-10 Year Treasury Bond ETF | -1.55% | |
| 10-20 Year Treasury Bond ETF | -2.52% | |
| 20+ Year Treasury Bond ETF | -3.56% |
🔍 Summary
The data illustrates a challenging environment for bondholders, particularly for long-duration securities. Persisting uncertainties around interest rate forecasts contribute to this bearish outlook. Investors may benefit from defensive positioning or explore alternatives to hedge against further declines in bond values.
Smart Data Insight
Master the Perfect Entry & Exit for this Stock
Don't leave your profits to chance. Historically, this stock follows specific seasonal patterns that institutional traders use to maximize returns.
- ✅ Identify the "Golden Buying Window"
- ✅ Avoid high-risk correction cycles
- ✅ Backtested data from the last 20+ years