July 02, 2026 a 12:32 pm


Bonds - Performance Analysis
The bond market has seen significant fluctuations recently, with varying impacts across different maturity sectors and bond types. Analyzing short, medium, and long-term performances provides critical insights for strategic adjustments in investment portfolios. In this review, we address weekly, monthly, and quarterly performance data, honing in on top performers, underperformers, consistent trends, and shifts that may affect future financial strategies.
Bonds Performance One Week
| Bond | Performance (%) | Performance |
|---|---|---|
| 1-3 Year Treasury Bond ETF | -0.30% | |
| High Yield Corporate Bond ETF | -0.36% | |
| 3-7 Year Treasury Bond ETF | -0.54% | |
| 7-10 Year Treasury Bond ETF | -0.81% | |
| TIPS Bond ETF | -1.22% | |
| 10-20 Year Treasury Bond ETF | -1.58% | |
| 20+ Year Treasury Bond ETF | -2.11% |
Bonds Performance One Month
| Bond | Performance (%) | Performance |
|---|---|---|
| 20+ Year Treasury Bond ETF | -0.10% | |
| 10-20 Year Treasury Bond ETF | -0.12% | |
| 1-3 Year Treasury Bond ETF | -0.22% | |
| 7-10 Year Treasury Bond ETF | -0.22% | |
| 3-7 Year Treasury Bond ETF | -0.23% | |
| High Yield Corporate Bond ETF | -0.38% | |
| TIPS Bond ETF | -1.64% |
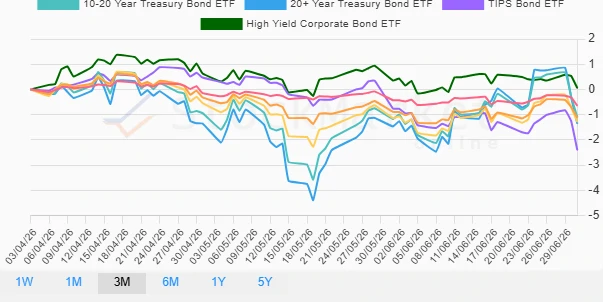
Bonds Performance Three Months
| Bond | Performance (%) | Performance |
|---|---|---|
| High Yield Corporate Bond ETF | 0.05% | |
| 20+ Year Treasury Bond ETF | -1.36% | |
| 7-10 Year Treasury Bond ETF | -1.29% | |
| 10-20 Year Treasury Bond ETF | -1.11% | |
| 3-7 Year Treasury Bond ETF | -1.13% | |
| 1-3 Year Treasury Bond ETF | -0.65% | |
| TIPS Bond ETF | -2.41% |
Summary
The bond market has demonstrated varied performance across short to long-duration maturities. Shorter-term bonds exhibited less volatility, with the High Yield Corporate Bond ETF providing a minor positive return over three months. However, the overall pressure of rising interest rates and inflationary expectations appears to have weighed heavily, particularly on longer-duration bonds and TIPs. Investors should remain vigilant, focusing on diversification and proactive management to mitigate risks in an evolving economic landscape.
Smart Data Insight
Master the Perfect Entry & Exit for this Stock
Don't leave your profits to chance. Historically, this stock follows specific seasonal patterns that institutional traders use to maximize returns.
- ✅ Identify the "Golden Buying Window"
- ✅ Avoid high-risk correction cycles
- ✅ Backtested data from the last 20+ years