June 26, 2026 a 02:03 pm


BXP: Trend and Support & Resistance Analysis - BXP, Inc.
BXP, Inc., a leading REIT, is strategically positioned in premier urban markets across the US. Evaluating recent stock data shows nuanced movements that could present unique investment potential. While technical indicators reflect recent fluctuations, the broader business model's solidity serves as a stabilizing factor. Strategic investments, such as ongoing property developments, may amplify future value, although current trends reflect immediate market dynamics. Cautious optimism is advised as market conditions evolve.
Trend Analysis
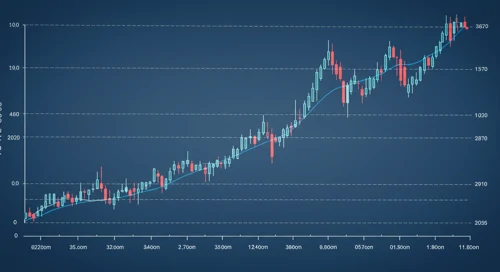
Utilizing a series of closing prices, we determined the recent trend of BXP's stock. The EMA20 and EMA50 calculations indicate a sideways pattern, suggesting no strong directional movement over the analyzed period. This is supported by recent price data showing modest variation. Notably, the prices over the last seven days are fluctuating near both moving averages, reinforcing the lack of a decisive trend.
| Date | Close Price | Trend |
|---|---|---|
| 2026-06-26 | $66.33 | ⚖️ Stable |
| 2026-06-25 | $65.67 | ⚖️ Stable |
| 2026-06-24 | $64.14 | ⚖️ Stable |
| 2026-06-23 | $64.34 | ⚖️ Stable |
| 2026-06-22 | $64.91 | ⚖️ Stable |
| 2026-06-18 | $64.70 | ⚖️ Stable |
| 2026-06-17 | $63.06 | ⚖️ Stable |
Currently, the trend is generally stable with slight fluctuations that suggest underlying stability without a strong directional bias.
Support and Resistance
From the examined data, key support and resistance zones have been identified at price levels consistently tested by market activities. By analyzing these zones, it appears that current prices hover near both resistance and support areas, suggesting potential for consolidation or breakout.
| Zone | Price Range |
|---|---|
| ❌ Resistance 1 | $66.50 - $67.00 |
| ✔️ Support 1 | $64.00 - $64.50 |
| ❌ Resistance 2 | $68.00 - $68.50 |
| ✔️ Support 2 | $63.00 - $63.50 |
The current price is close to the first support zone. This positioning suggests potential stabilization but also raises caution about possible downward pressure if support levels don't hold.
Conclusion
BXP, Inc. maintains a stable position owing to its strong market presence in the premier urban real estate sector. Currently, the technical analysis suggests a neutral price trend with fluctuations within established support and resistance zones. The company’s ongoing property developments may bolster future growth potential, though short-term price movements reflect a wait-and-see approach among investors. As such, potential investors should weigh BXP's long-term strategic advantages against near-term market stability. Analyst interpretations suggest cautious optimism; however, continued monitoring of both market trends and company announcements is recommended.
Smart Data Insight
Master the Perfect Entry & Exit for this Stock
Don't leave your profits to chance. Historically, this stock follows specific seasonal patterns that institutional traders use to maximize returns.
- ✅ Identify the "Golden Buying Window"
- ✅ Avoid high-risk correction cycles
- ✅ Backtested data from the last 20+ years