April 29, 2026 a 02:03 pm
BXP: Trend and Support & Resistance Analysis - BXP, Inc.
Boston Properties, Inc. (NYSE:BXP) is showing a notable market behavior. Currently, the stock is reflecting a potential trend reversal, with technical indicators unveiling crucial insights. As the largest publicly-held developer of Class A office properties in the U.S., BXP remains a crucial indicator for the real estate sector, particularly in its five core markets.
Trend Analysis
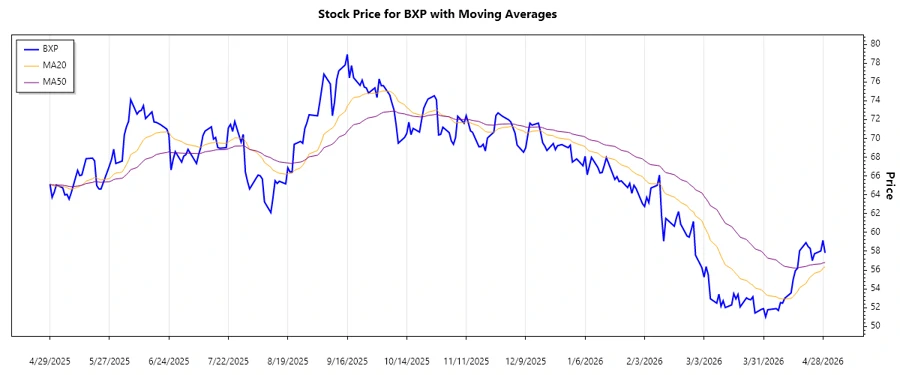
The analysis of the recent price movements in BXP stock shows the calculation of EMA20 and EMA50, which are critical in identifying the ongoing trend. The crossover of these EMA lines indicates subtle shifts in market sentiment.
| Date | Close Price $ | Trend |
|---|---|---|
| 2026-04-29 | 57.82 | ▼ |
| 2026-04-28 | 59.16 | ▼ |
| 2026-04-27 | 58.03 | ▼ |
| 2026-04-24 | 57.73 | ▼ |
| 2026-04-23 | 57.00 | ▼ |
| 2026-04-22 | 58.29 | ▲ |
| 2026-04-21 | 58.50 | ▲ |
Based on the EMAs, the market recently experienced a ▼ downward trend, pinpointing potential buy signals as prices may soon stabilize or recover.
Support and Resistance
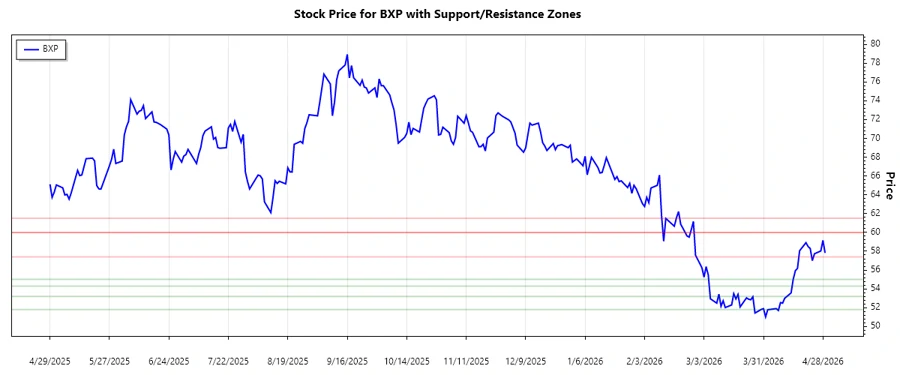
Support and resistance zones have been identified based on historical closing prices, providing a map of potential price action levels.
| Zone Type | Range |
|---|---|
| Resistance Zone 1 | 60.00 - 61.50 ▲ |
| Resistance Zone 2 | 57.40 - 60.00 ▲ |
| Support Zone 1 | 54.30 - 55.00 ▼ |
| Support Zone 2 | 51.80 - 53.20 ▼ |
The stock is currently trading near the upper resistance zone, suggesting bullish momentum if a breakout occurs.
Conclusion
BXP is currently navigating in a challenging yet defining market position, with indicators hinting at a potential recovery. The recent trend underlines market weaknesses that may reverse, presenting strategic entry points for investors. However, a close watch on resistance levels is essential as any breakout may validate an uptrend, offering substantial returns. The overall performance sustains BXP’s influence in the REIT domain, particularly as economic conditions fluctuate.
json ### Technical Analysis #### Calculations of EMA: - **EMA20** and **EMA50** are calculated using the closing prices, with the EMAs providing insights into both short and medium-term trends. The downward trajectory as evidenced by the position of EMA20 below EMA50 over recent sessions suggests caution among traders pending clear market direction. #### Support & Resistance Zones: - The highlighted support zones suggest potential price bottoms where buying pressure could re emerge, whereas resistance zones imply levels prices have struggled to break through in recent periods. BXP's recent approach to the resistance signifies impending market testing of investor resolve in rally sustainability. Overall, BXP is in an intriguing market position; careful monitoring of zones and EMAs will remain essential.