February 02, 2026 a 02:03 pm

BXP: Trend and Support & Resistance Analysis - BXP, Inc.
Boston Properties (BXP) shows a dynamic performance in the real estate investment sector, focusing on Class A office properties in top U.S. markets. Despite the complexities of urban real estate, BXP's strategic placement in key metropolitan areas provides leverage in market fluctuations. Investors should note the firm's steady real estate portfolio expansion, impacting overall financial health. Recent stock activity suggests potential opportunities for both short-term gains and long-term growth. In light of current market trends, BXP remains a pivotal player to watch for informed investment choices.
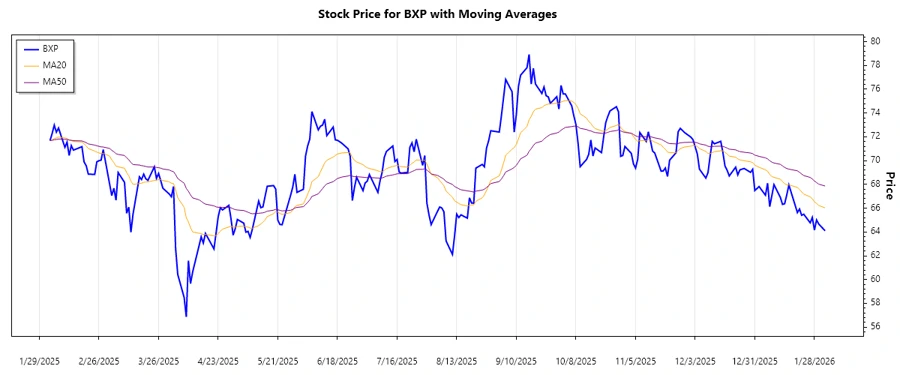
Trend Analysis
| Date | Closing Price | Trend |
|---|---|---|
| 02-Feb-2026 | 64.10 | ▼ Abwärtstrend |
| 30-Jan-2026 | 64.67 | ▼ |
| 29-Jan-2026 | 65.01 | ▼ |
| 28-Jan-2026 | 64.15 | ▼ |
| 27-Jan-2026 | 65.22 | ▼ |
| 26-Jan-2026 | 64.77 | ▼ |
| 23-Jan-2026 | 65.49 | ▼ |
The prevailing trend indicates a declining EMA20 well below EMA50, signaling a potential sustained downtrend. This suggests bearish momentum in the broader market sentiment for BXP. Investors might see this as a cautionary indicator for entry points.
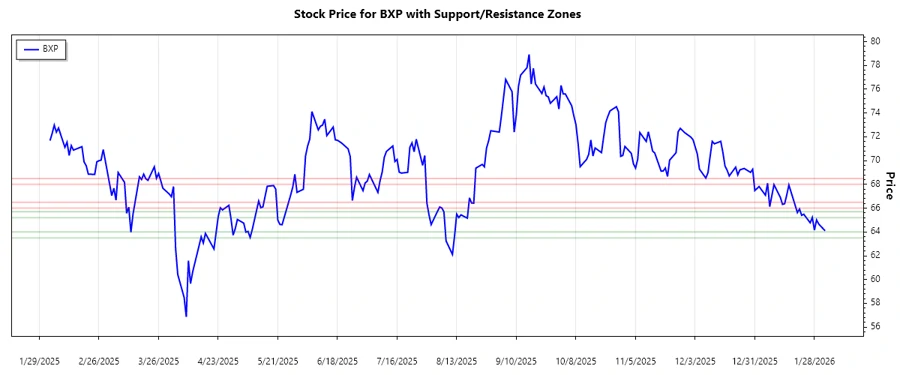
Support and Resistance
| Zone Type | From | To |
|---|---|---|
| Support Zone 1 | 63.50 | 64.00 |
| Support Zone 2 | 65.20 | 65.70 |
| Resistance Zone 1 | 66.00 | 66.50 |
| Resistance Zone 2 | 68.00 | 68.50 |
The current stock on the lower spectrum between 63.50 and 64.00 indicates proximity to a support zone, implying potential reversal or consolidation areas. The given resistance zones serve as benchmarks for upward movement barriers. Investors should monitor if the price holds this support level for potential recovery.
Conclusion
Boston Properties (BXP) is amid a downward trend, balanced by immediate proximity to key support zones, suggesting possible stabilization points. Despite the negative short-term trend, BXP’s robust urban real estate positioning provides a buffer, potentially mitigating severe downturns. Investors should weigh the technical downtrend, considering market conditions and business fundamentals before commitment. The resistance levels indicate strategic exit points, vital for maximizing returns. Future performances remain subject to economic fluctuations impacting urban office demands. Coupled with macroeconomic insights, technical indicators could offer refined investment strategies.