
July 19, 2026 a 10:15 am
BXP: Fibonacci Analysis - BXP, Inc.
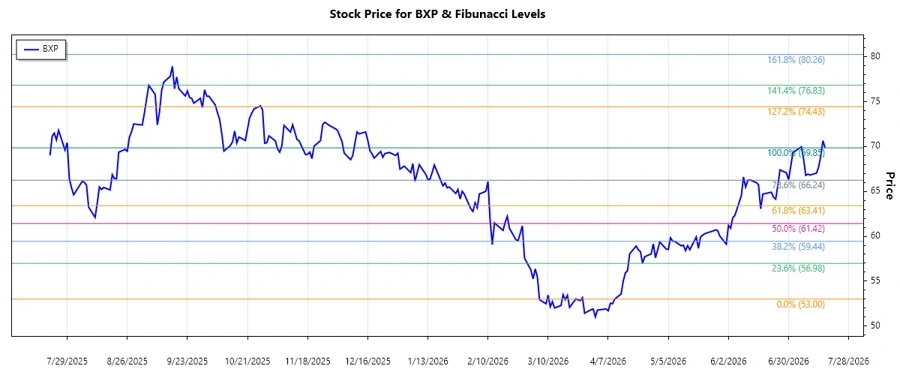
The stock of BXP, Inc. (Ticker: BXP) shows a dynamic pattern focusing on its premier Class A office properties across key U.S. urban centers. Recent historical data analysis indicates a dominant upward trend, suggesting a potential for growth, yet investors should be cautious of market volatility. As a REIT, BXP is well-positioned in the real estate sector, yet it remains sensitive to economic shifts influencing commercial real estate demand.
Fibonacci Analysis
| Details | Information |
|---|---|
| Start Date | 2026-04-10 |
| End Date | 2026-07-17 |
| High Point | 69.85 on 2026-07-17 |
| Low Point | 53.00 on 2026-04-10 |
| Fibonacci Level | Price |
|---|---|
| 0.236 | 56.94 |
| 0.382 | 59.42 |
| 0.5 | 61.43 |
| 0.618 | 63.43 |
| 0.786 | 66.06 |
The current price, as of the most recent data point, is 69.85, suggesting the stock is no longer in a retracement zone but rather continuing its upward trend.
Fibonacci levels suggest that 66.06 could provide support and the stock may encounter resistance beyond 69.85.
Conclusion
BXP, Inc.’s stock price movement indicates a significant upward trend, with current evaluations showing potential advancement beyond previously predicted resistance. Investors should note the established support levels as outlined by Fibonacci analysis, which suggests continued stability with potential short-term retracements. However, given market volatility and economic impacts on real estate, a cautious outlook is recommended. Analysts emphasize watching for key price movements relative to established Fibonacci levels.
Smart Data Insight
Master the Perfect Entry & Exit for this Stock
Don't leave your profits to chance. Historically, this stock follows specific seasonal patterns that institutional traders use to maximize returns.
- ✅ Identify the "Golden Buying Window"
- ✅ Avoid high-risk correction cycles
- ✅ Backtested data from the last 20+ years