August 25, 2025 a 07:32 am

BXP: Dividend Analysis - Boston Properties, Inc.
Boston Properties, Inc. (BXP) exhibits a notable dividend profile, characterized by a consistent payment history but facing challenges in terms of growth and payout sustainability. The current yield of 5.81% is attractive; however, the modest dividend growth and high payout ratios warrant a cautious outlook. This analysis explores the company's dividend health and financial resilience in greater detail.
Overview 📊
Boston Properties, Inc., a leading entity in the Real Estate sector, showcases a well-established dividend history complemented by a robust yield. Despite these strengths, the recent lack of dividend growth and substantial payout ratios emphasize the importance of a thorough financial evaluation.
| Attribute | Details |
|---|---|
| Sector | Real Estate |
| Dividend Yield | 5.81% |
| Current Dividend Per Share | 4.38 USD |
| Dividend History | 29 years |
| Last Cut/Suspension | None |
Dividend History 🗓️
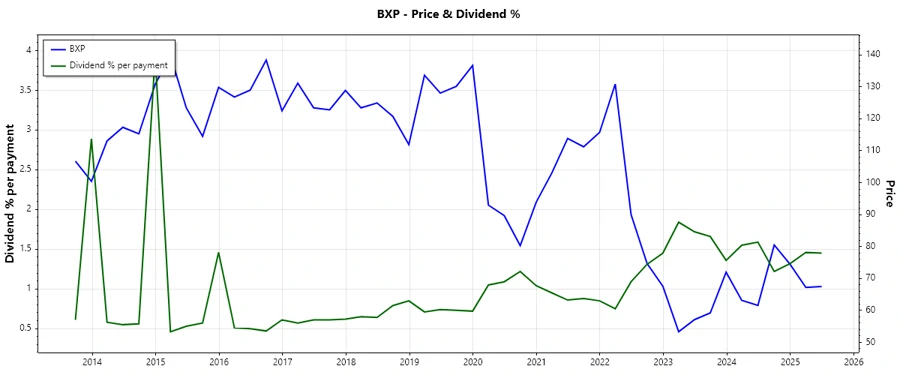
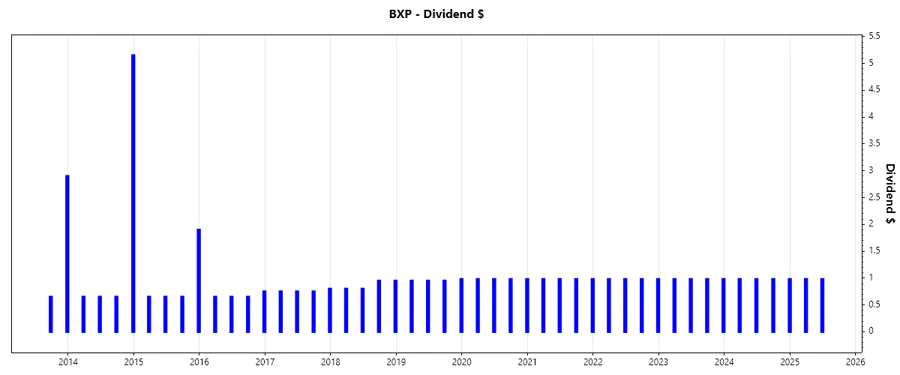
A solid track record is vital, showing investor commitment with 29 years of dividends. Consistency matters, enhancing shareholder value even in turbulent times.
| Year | Dividend Per Share (USD) |
|---|---|
| 2025 | 1.96 |
| 2024 | 3.92 |
| 2023 | 3.92 |
| 2022 | 3.92 |
| 2021 | 3.92 |
Dividend Growth 📈
Growth trends reflect a company's future payout potential. A static growth over recent years suggests a focus on maintaining current levels rather than expansion, which could imply stability amidst market turbulence.
| Time | Growth |
|---|---|
| 3 years | 0 % |
| 5 years | 0.47 % |
The average dividend growth is 0.47% over 5 years. This shows moderate but steady dividend growth.
Payout Ratio 🎯
The payout ratio measures financial stability relating to dividend sustainability. The EPS-based ratio of 14028.35% is significant, indicating potential unsustainability, whereas FCF-based ratio of 78.51% suggests a more balanced approach.
| Key figure ratio | Value |
|---|---|
| EPS-based | 14028.35% |
| Free Cash Flow-based | 78.51% |
Cashflow & Capital Efficiency 💵
Cash flow analysis reveals operational leverage and efficiency in capital usage. BXP's free cash flow and its efficient allocation of resources is crucial for long-term sustainability.
| Metric | 2024 | 2023 | 2022 |
|---|---|---|---|
| Free Cash Flow Yield | 10.54% | 11.80% | 8.35% |
| Earnings Yield | 0.12% | 1.72% | 5.51% |
| CAPEX to Operating Cash Flow | - | - | 31.04% |
| Stock-based Compensation to Revenue | 1.29% | - | 1.67% |
| Free Cash Flow / Operating Cash Flow Ratio | 100% | 100% | 68.96% |
These figures suggest that BXP's cash flow situation is stable, leveraging effective resource management for sustained operations.
Balance Sheet & Leverage Analysis 🏦
Understanding BXP's balance sheet strength is crucial. Higher debt metrics can impact financial flexibility; it’s crucial to weigh debt against equity and assets.
| Metric | 2024 | 2023 | 2022 |
|---|---|---|---|
| Debt-to-Equity | 3.14 | 2.83 | 2.40 |
| Debt-to-Assets | 0.65 | 0.64 | 0.61 |
| Debt-to-Capital | 0.76 | 0.74 | 0.71 |
| Net Debt to EBITDA | 8.24 | 8.09 | 7.91 |
| Current Ratio | 0.92 | - | - |
| Quick Ratio | 2.56 | 4.19 | 3.16 |
While the leverage is high, which could potentially restrict flexibility, the quick ratios suggest substantial asset flexibility to meet short-term obligations.
Fundamental Strength & Profitability 📈
Assessing profitability ratios against industry averages can determine competitive positioning and resource utilization effectiveness.
| Metric | 2024 | 2023 | 2022 |
|---|---|---|---|
| Return on Equity | 0.26% | 3.24% | 9.51% |
| Return on Assets | 0.05% | 0.73% | 2.41% |
| Net Margin | 0.42% | 5.81% | 18.77% |
| EBIT Margin | 21.40% | 26.61% | 46.89% |
| EBITDA Margin | 55.99% | 57.00% | 56.94% |
| Gross Margin | 34.68% | 62.72% | 63.03% |
| Research & Development to Revenue | 0% | 0% | 0% |
While the consistency of margins and returns indicates underlying strength, growth opportunities could be limited due to constrained resources.
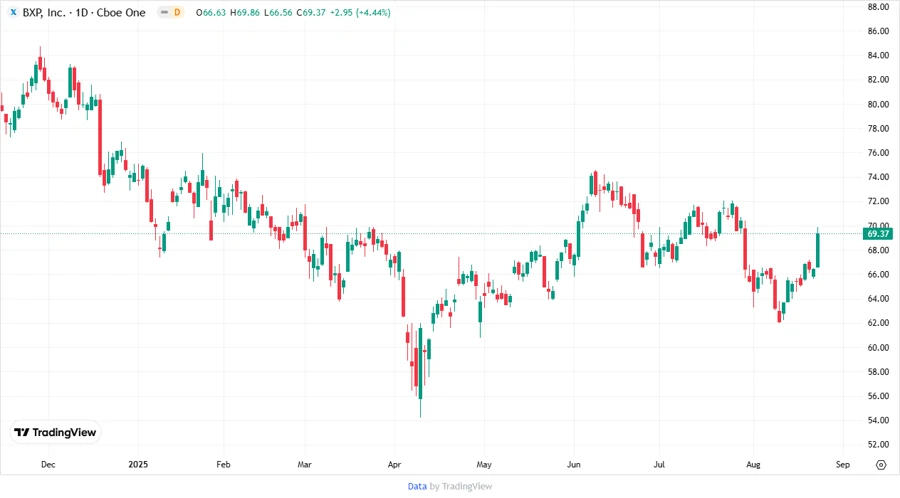
Price Development 🚀
Dividend Scoring System ✅
Our individualized scoring approach evaluates the dividend health by blending several financial metrics into an overall score.
| Category | Score | Strength |
|---|---|---|
| Dividend yield | 4 | |
| Dividend Stability | 5 | |
| Dividend growth | 2 | |
| Payout ratio | 2 | |
| Financial stability | 3 | |
| Dividend continuity | 5 | |
| Cashflow Coverage | 4 | |
| Balance Sheet Quality | 3 |
Overall Score: 28/40
Rating 🏆
Analyzing Boston Properties Inc.'s (BXP) dividend offerings reveals a company committed to consistent payouts but encountering limitations on growth. The dividend yield remains attractive, but unresolved growth and payout concerns demand investor attention. Therefore, BXP can be cautiously recommended for income-seeking investors aware of its moderate risk profile due to financial leverage.
Smart Data Insight
Master the Perfect Entry & Exit for this Stock
Don't leave your profits to chance. Historically, this stock follows specific seasonal patterns that institutional traders use to maximize returns.
- ✅ Identify the "Golden Buying Window"
- ✅ Avoid high-risk correction cycles
- ✅ Backtested data from the last 20+ years