August 05, 2025 a 11:31 am


BXP: Dividend Analysis - Boston Properties, Inc.
Boston Properties, Inc., a renowned real estate investment trust, demonstrates a formidable dividend profile with a consistent history of 29 years of dividend payments. Though the EPS-based payout ratio is drastically negative, reflecting recent financial challenges, its free cash flow payout remains relatively stable. This indicates a potentially resilient cash flow backing for sustained dividends despite market fluctuations.
Overview 📊
| Metric | Details |
|---|---|
| Sector | Real Estate |
| Dividend Yield | 5.81 % |
| Current Dividend per Share | 4.38 USD |
| Dividend History | 29 years |
| Last Cut or Suspension | None |
Dividend History 📈
Boston Properties, Inc. has maintained a robust dividend payment history, reflecting the company's commitment to shareholder returns. A stable dividend inflow is critical for income-focused investors keen on long-term value.
| Year | Dividend per Share (USD) |
|---|---|
| 2025 | 1.96 |
| 2024 | 3.92 |
| 2023 | 3.92 |
| 2022 | 3.92 |
| 2021 | 3.92 |
Dividend Growth 📈
The examination of dividend growth in the past years is pivotal for gauging the company's financial health and future payout capabilities. Despite challenges, a slight growth over five years demonstrates efforts towards financial sustainability.
| Time | Growth |
|---|---|
| 3 years | 0 % |
| 5 years | 0.47 % |
The average dividend growth is 0.47 % over 5 years. This shows moderate but steady dividend growth, signifying a cautious yet persistent drive to augment payouts over time.
Payout Ratio 🗣️
Payout ratios are indicative of how much of the earnings are distributed as dividends. While an EPS-based negative payout ratio signals potential operational hurdles, the free cash flow-based ratio underscores more resilient income streams ensuring dividend cover.
| Key figure | Ratio |
|---|---|
| EPS-based | -15631.16 % |
| Free cash flow-based | 78.48 % |
The EPS-based payout ratio of -15631.16 % reflects challenges in profitability, while the FCF-based payout ratio of 78.48 % indicates better cash flow management despite earnings pressures.
Cashflow & Capital Efficiency 📉
Effective cash flow management and capital efficiency are cornerstones of sustained operations and dividends. Boston Properties, Inc. showcases these capabilities through substantial yields and prudent capital allocation strategies.
| Metric | 2024 | 2023 | 2022 |
|---|---|---|---|
| Free Cash Flow Yield | 10.54 % | 11.80 % | 8.35 % |
| Earnings Yield | 0.12 % | 1.72 % | 5.51 % |
| CAPEX to Operating Cash Flow | 0 % | 0 % | 31.04 % |
| Stock-based Compensation to Revenue | 1.29 % | 0 % | 1.67 % |
| Free Cash Flow / Operating Cash Flow Ratio | 1 | 1 | 0.69 |
The company's ability to maintain stable cash flows and effective capital use is a positive indicator of its long-term investment quality and dividend reliability.
Balance Sheet & Leverage Analysis ⚠️
A comprehensive analysis of the balance sheet and leverage ratios sheds light on the financial stability and debt management strategies of Boston Properties, Inc. Despite relatively high leverage, liquidity parameters suggest efficient capital management.
| Metric | 2024 | 2023 | 2022 |
|---|---|---|---|
| Debt-to-Equity | 3.14 | 2.83 | 2.40 |
| Debt-to-Assets | 65.11 % | 63.88 % | 60.70 % |
| Debt-to-Capital | 75.83 % | 73.88 % | 70.55 % |
| Net Debt to EBITDA | 8.24 | 8.09 | 7.91 |
| Current Ratio | 2.56 | 4.19 | 3.16 |
| Quick Ratio | 2.56 | 4.19 | 3.16 |
Despite high debt ratios, the company's strong quick and current ratios imply adequate liquidity to meet short-term obligations and sustain operations.
Fundamental Strength & Profitability ✅
Analyzing profitability metrics provides insights into the operational efficiency and potential for wealth generation at Boston Properties, Inc. The profitability margins indicate a firm position for value creation and sustained growth.
| Metric | 2024 | 2023 | 2022 |
|---|---|---|---|
| Return on Equity | 0.26 % | 3.24 % | 9.51 % |
| Return on Assets | 0.05 % | 0.73 % | 2.41 % |
| Net Profit Margin | 0.42 % | 5.81 % | 18.77 % |
| Gross Profit Margin | 34.68 % | 62.72 % | 63.03 % |
| EBIT Margin | 21.40 % | 26.61 % | 46.89 % |
| EBITDA Margin | 55.99 % | 56.98 % | 56.94 % |
| Research & Development to Revenue | 0 % | 0 % | 0 % |
The high gross and EBITDA margins are indicative of efficient operations and competitive market positioning, contributing to the firm’s profitability.
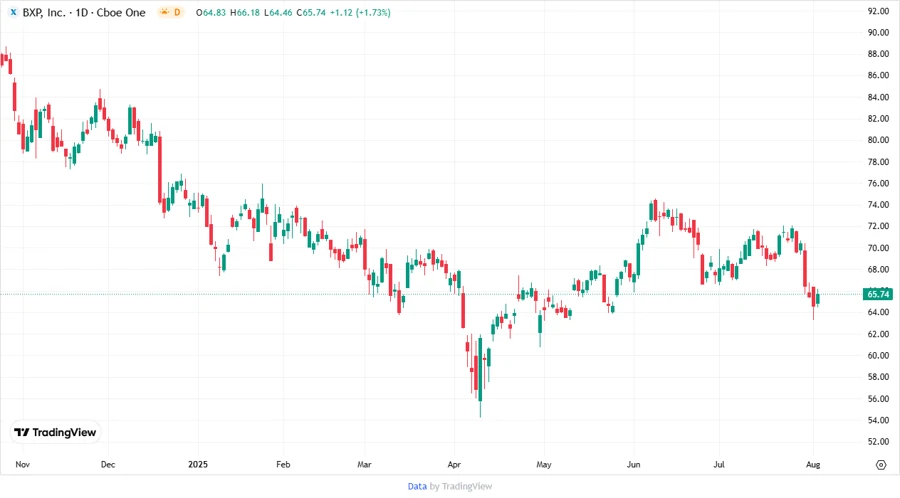
Price Development 📊
Dividend Scoring System 📋
| Criterion | Score (out of 5) | Bar |
|---|---|---|
| Dividend Yield | 4 | |
| Dividend Stability | 5 | |
| Dividend Growth | 2 | |
| Payout Ratio | 3 | |
| Financial Stability | 3 | |
| Dividend Continuity | 5 | |
| Cashflow Coverage | 4 | |
| Balance Sheet Quality | 3 |
Total Score: 29/40
Rating 🕵️♂️
Boston Properties, Inc. presents a sound investment option within the real estate sector for dividend-focused portfolios, despite certain profitability challenges. Its firm commitment to maintaining dividend continuity alongside a cautious capital strategy accentuates potential for future value creation. With a strong history of dividend payouts and moderate financial stability, the recommendation is a "Hold" for income-focused investors seeking steady returns.
Smart Data Insight
Master the Perfect Entry & Exit for this Stock
Don't leave your profits to chance. Historically, this stock follows specific seasonal patterns that institutional traders use to maximize returns.
- ✅ Identify the "Golden Buying Window"
- ✅ Avoid high-risk correction cycles
- ✅ Backtested data from the last 20+ years