July 18, 2025 a 03:31 am


BXP: Dividend Analysis - Boston Properties, Inc.
Boston Properties, Inc. offers a competitive dividend yield of 5.81%, supported by a consistent 29-year dividend history. However, recent financial figures suggest stability challenges with notable payout ratio discrepancies. The current financial landscape demands cautious optimism.
📊 Overview
Boston Properties, Inc. operates in the sector with a robust dividend yield of 5.81%. The current dividend per share stands at $4.38, backed by an impressive 29-year dividend history without recent cuts or suspensions, indicating strong investor confidence.
| Metric | Value |
|---|---|
| Sector | Real Estate |
| Dividend Yield | 5.81% |
| Current Dividend Per Share | $4.38 |
| Dividend History | 29 years |
| Last Cut or Suspension | None |
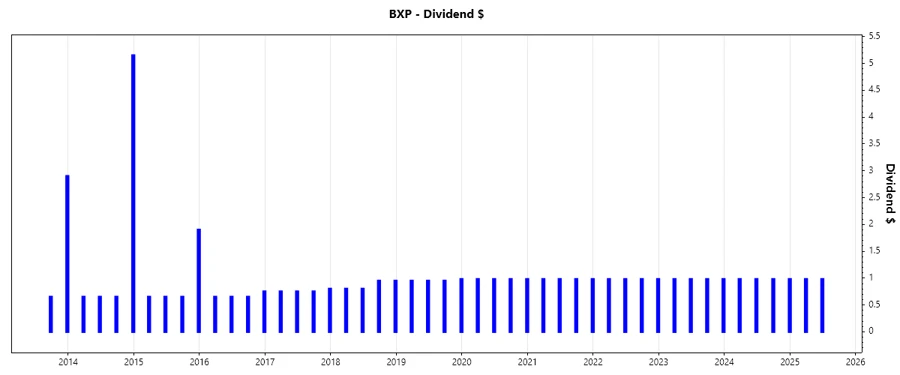
🗣️ Dividend History
A stable dividend history can act as a measure of a company's financial health and management's commitment to returning value to shareholders. Boston Properties maintains a long track record of regular dividend payments, enhancing its attractiveness to income-focused investors.
| Year | Dividend Per Share (USD) |
|---|---|
| 2025 | 1.96 |
| 2024 | 3.92 |
| 2023 | 3.92 |
| 2022 | 3.92 |
| 2021 | 3.92 |
📈 Dividend Growth
The growth rate of dividends is crucial as it reflects a company's potential to increase shareholder returns over time. Unfortunately, Boston Properties has displayed negligible growth in its dividends over the last 3 to 5 years, suggesting limitations in dividend escalation.
| Time | Growth |
|---|---|
| 3 years | 0.00% |
| 5 years | 0.47% |
The average dividend growth is 0.47% over 5 years. This shows moderate but steady dividend growth.
💡 Payout Ratio
The payout ratio provides insight into the proportion of earnings paid to shareholders in dividends. Boston Properties sees an EPS-based payout ratio of -15631.16% due to negative earnings and a more sustainable FCF-based ratio of 60.47%, highlighting potential future dividend sustainability challenges.
| Key Figure Ratio | Value |
|---|---|
| EPS-based | -15631.16% |
| Free Cash Flow-based | 60.47% |
The current payout levels emphasize caution: the EPS-based figure suggests unsustainable earnings coverage, while FCF-based indicates standard practices.
💰 Cashflow & Capital Efficiency
An analysis of cash flows reveals the company's ability to sustain operations and dividends. The relevant metrics in recent years suggest a strong free cash flow yield, but a high net debt to EBITDA highlights leverage risks, necessitating careful cash flow management for growth.
| Metric | 2024 | 2023 | 2022 |
|---|---|---|---|
| Free Cash Flow Yield | 10.54% | 11.80% | 8.35% |
| Earnings Yield | 0.12% | 1.72% | 5.51% |
| CAPEX to Operating Cash Flow | 8.00% | N/A | 31.04% |
| Stock-based Compensation to Revenue | 1.40% | N/A | 1.67% |
| Free Cash Flow / Operating Cash Flow | 100% | 100% | 68.96% |
Overall, Boston Properties shows strong cash flow metrics, albeit under pressure from its high leverage. Efficient capital allocation will be key moving forward.
🏦 Balance Sheet & Leverage Analysis
The balance sheet reveals a heavily levered company with a robust financial leverage and debt-to-equity ratio. The management of such high levels of debt will be critical in maintaining financial stability and dividend viability.
| Metric | 2024 | 2023 | 2022 |
|---|---|---|---|
| Debt-to-Equity | 3.14 | 2.83 | 2.40 |
| Debt-to-Assets | 0.65 | 0.64 | 0.61 |
| Debt-to-Capital | 0.76 | 0.74 | 0.71 |
| Net Debt to EBITDA | 8.24 | 8.09 | 7.91 |
| Current Ratio | 2.51 | 4.19 | 3.16 |
| Quick Ratio | 2.51 | 4.19 | 3.16 |
| Financial Leverage | 4.82 | 4.43 | 3.95 |
Boston Properties must prioritize decreasing debt obligations to improve its leverage metrics, ensuring long-term operational efficiency and financial health.
📊 Fundamental Strength & Profitability
Essential performance metrics like ROI, ROE, and different margins illustrate Boston Properties' capability to generate profit relative to its equity, assets, and other investments. Despite some recent improvements, more substantial profitability would be requisite to sustain investor interests and dividends.
| Metric | 2024 | 2023 | 2022 |
|---|---|---|---|
| Return on Equity | 0.26% | 3.24% | 9.51% |
| Return on Assets | 0.05% | 0.73% | 2.41% |
| Net Margin | 0.42% | 5.81% | 18.77% |
| EBIT Margin | 21.40% | 26.61% | 46.89% |
| EBITDA Margin | 55.99% | 56.98% | 56.94% |
| R&D to Revenue | N/A | N/A | 0.00% |
While Boston Properties shows compelling profitability metrics, ongoing efforts are required to translate these into optimized shareholder returns and stable dividends.
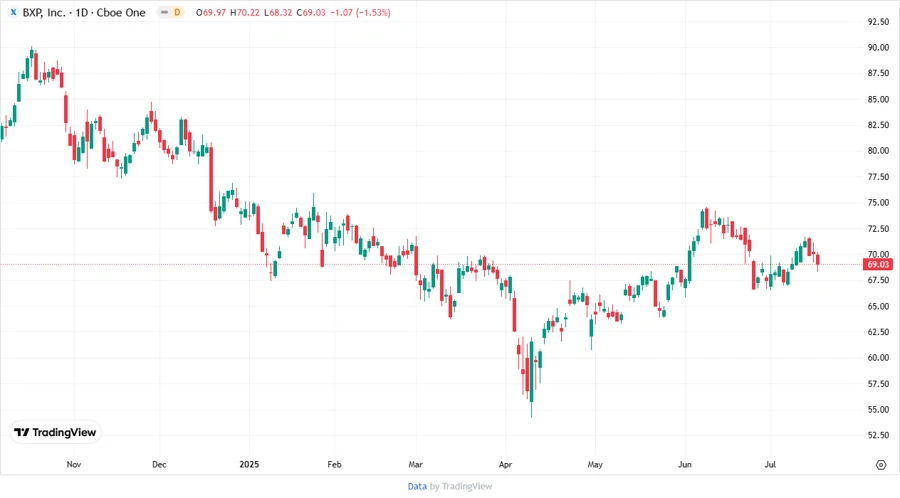
📉 Price Development
✅ Dividend Scoring System
| Criterion | Score | Score Bar |
|---|---|---|
| Dividend Yield | 4 | |
| Dividend Stability | 4 | |
| Dividend Growth | 2 | |
| Payout Ratio | 2 | |
| Financial Stability | 3 | |
| Dividend Continuity | 4 | |
| Cashflow Coverage | 3 | |
| Balance Sheet Quality | 3 |
Overall Score: 25/40
🏆 Rating
Boston Properties, Inc. offers a competitive dividend yield and established payout history, making it attractive for income-seeking investors. However, substantial financial leverage and limited recent dividend growth indicate a cautious outlook. Potential investors should weigh these factors thoughtfully before committing.
Smart Data Insight
Master the Perfect Entry & Exit for this Stock
Don't leave your profits to chance. Historically, this stock follows specific seasonal patterns that institutional traders use to maximize returns.
- ✅ Identify the "Golden Buying Window"
- ✅ Avoid high-risk correction cycles
- ✅ Backtested data from the last 20+ years