June 06, 2025 a 03:31 am

BXP: Dividend Analysis - Boston Properties, Inc.
Boston Properties boasts a significant presence in the real estate sector. With a steady dividend history, it offers an attractive yield, however, the negative EPS payout ratio requires cautious optimism. Investors should weigh the stability offered by its extensive dividend history against recent financial challenges.
📊 Overview
Detailed assessment of Boston Properties' dividend metrics and sector relevance highlights a robust dividend yield, indicative of substantial returns to shareholders.
| Sector | Dividend Yield | Current Dividend per Share (USD) | Dividend History (Years) | Last Cut or Suspension |
|---|---|---|---|---|
| Real Estate | 5.83% | 4.38 | 29 | None |
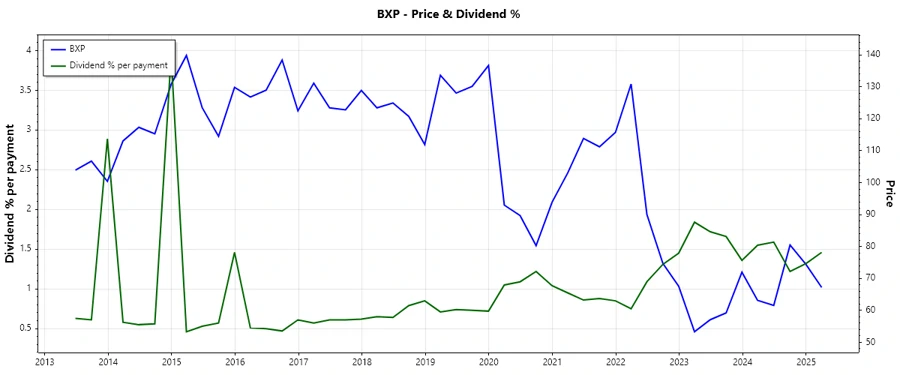
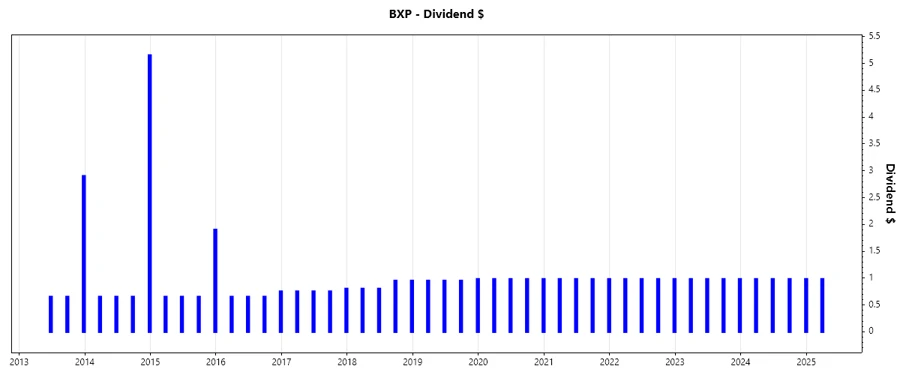
📈 Dividend History
Understanding the dividend history is critical for assessing long-term reliability. Boston Properties' consistent dividend payments highlight its commitment to returning value to shareholders.
| Year | Dividend per Share (USD) |
|---|---|
| 2025 | 0.98 |
| 2024 | 3.92 |
| 2023 | 3.92 |
| 2022 | 3.92 |
| 2021 | 3.92 |
📉 Dividend Growth
The dividend growth metric is essential in evaluating potential future increases in shareholder returns. Currently, Boston Properties exhibits minimal growth reflecting stability more than expansive profitability.
| Time | Growth |
|---|---|
| 3 Years | 0% |
| 5 Years | 0.47% |
The average dividend growth is 0.47% over 5 years. This shows moderate but steady dividend growth.
✅ Payout Ratio
Payout ratios offer insights into sustainability; EPS-based figures are highly negative, indicating potential strain, whereas FCF shows a more sustainable level, implying careful cash management.
| Key Figure | Ratio |
|---|---|
| EPS-based | -15631.16% |
| Free cash flow-based | 72.90% |
The EPS payout ratio is alarmingly high, indicative of unsustainable earnings distribution, while the FCF payout ratio maintains a healthier proportion but suggests caution.
Cashflow & Capital Efficiency
Evaluation of cash flow and capital metrics provides a thorough understanding of operational efficiency and sustainability. Boston Properties shows variable capital allocation reflected in its Free Cash Flow Yield and earnings yield metrics.
| Year | 2024 | 2023 | 2022 |
|---|---|---|---|
| Free Cash Flow Yield | 10.54% | 11.80% | 8.35% |
| Earnings Yield | 0.12% | 1.72% | 5.51% |
| CAPEX to Operating Cash Flow | 0% | 0% | 31.04% |
| Stock-based Compensation to Revenue | 1.29% | 0% | 1.67% |
| Free Cash Flow / Operating Cash Flow Ratio | 1 | 1 | 0.69 |
The data reflects mixed stability in cash flow across recent years, with 2022 showing particular capital outflow pressures.
Balance Sheet & Leverage Analysis
Thorough understanding of leverage ratios and liquidity informs stakeholders on fiscal health. Boston Properties' debt metrics suggest cautious capital management while maintaining liquidity positions.
| Year | 2024 | 2023 | 2022 |
|---|---|---|---|
| Debt-to-Equity | 3.14 | 2.83 | 2.40 |
| Debt-to-Assets | 0.65 | 0.64 | 0.61 |
| Debt-to-Capital | 0.76 | 0.74 | 0.71 |
| Net Debt to EBITDA | 8.78 | 8.09 | 7.91 |
| Current Ratio | 2.51 | 4.19 | 3.16 |
| Quick Ratio | 2.51 | 4.19 | 3.16 |
| Financial Leverage | 4.82 | 4.43 | 3.95 |
The increasing debt-to-equity ratio indicates climbing leverage, while stable current and quick ratios ensure near-term solvency.
Fundamental Strength & Profitability
Profitability metrics highlight resource efficiency and financial strength. Despite recent challenges, Boston Properties demonstrates robust gross and EBITDA margins.
| Year | 2024 | 2023 | 2022 |
|---|---|---|---|
| Return on Equity | 0.27% | 3.24% | 9.51% |
| Return on Assets | 0.05% | 0.73% | 2.41% |
| Net Margin | 0.42% | 5.81% | 18.77% |
| EBIT Margin | 21.40% | 26.61% | 46.89% |
| EBITDA Margin | 55.99% | 56.98% | 56.94% |
| Gross Margin | 61.16% | 62.72% | 63.03% |
| Research & Development to Revenue | 0% | 0% | 0.00001% |
The improvement in return metrics over the years suggests effective management amidst operational pressures.
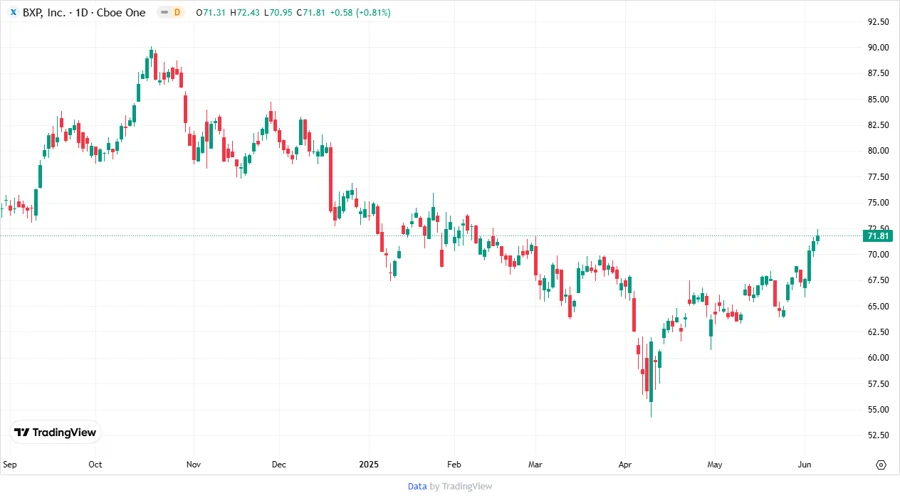
Price Development
🗣️ Dividend Scoring System
| Category | Score | Score Bar |
|---|---|---|
| Dividend Yield | 4 | |
| Dividend Stability | 5 | |
| Dividend Growth | 2 | |
| Payout Ratio | 2 | |
| Financial Stability | 3 | |
| Dividend Continuity | 4 | |
| Cashflow Coverage | 3 | |
| Balance Sheet Quality | 3 |
Total Score: 26/40
Rating
In conclusion, Boston Properties represents a stable investment in the real estate sector, supported by a resilient dividend history, yet potential investors must consider the ongoing high leverage and negative EPS payout ratios before staking capital.
Smart Data Insight
Master the Perfect Entry & Exit for this Stock
Don't leave your profits to chance. Historically, this stock follows specific seasonal patterns that institutional traders use to maximize returns.
- ✅ Identify the "Golden Buying Window"
- ✅ Avoid high-risk correction cycles
- ✅ Backtested data from the last 20+ years