
June 09, 2026 a 07:31 am

BXP: Dividend Analysis - BXP, Inc.
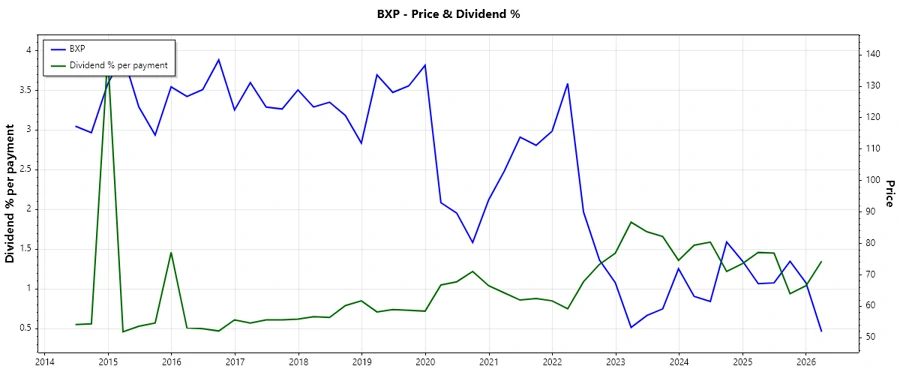
BXP, Inc. is a well-established player within its sector, boasting a notable history of dividend payments. However, the substantial payout ratio combined with its current dividend yield suggests the need for careful analysis. Over the past years, the company's dividend growth has been stagnant, signaling potential challenges in sustaining historical dividend levels.
📊 Overview
The company operates in the diversified sector, providing a robust dividend yield of 5.93%. The current dividend per share stands at $4.04, maintained over an impressive 30-year history without any recent cuts or suspensions, which indicates strength in dividend security.
| Sector | Dividend Yield (%) | Current Dividend (USD) | Dividend History (Years) | Last Cut/Suspension |
|---|---|---|---|---|
| Diversified | 5.93% | 4.04 USD | 30 years | None |
🗣️ Dividend History
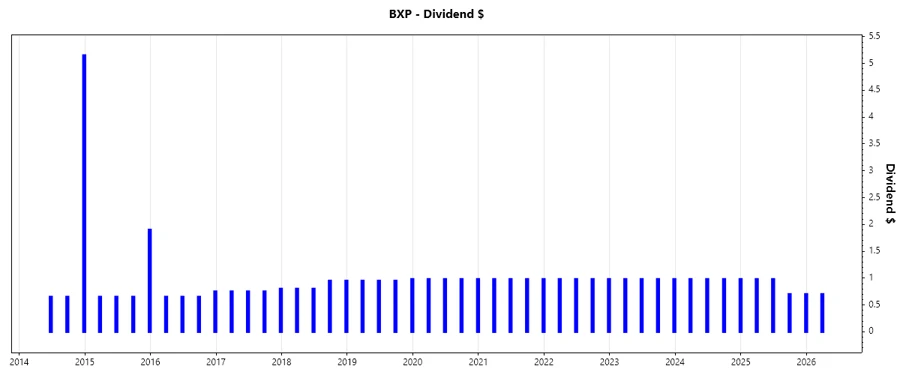
BXP has sustained a strong dividend history over the years. This stability is crucial for income-focused investors who rely on consistent returns.
| Year | Dividend Per Share (USD) |
|---|---|
| 2026 | 0.70 |
| 2025 | 3.36 |
| 2024 | 3.92 |
| 2023 | 3.92 |
| 2022 | 3.92 |
📈 Dividend Growth
Assessing dividend growth is essential to determine the future potential of dividend increases and investor returns. While the 3-year growth is negative at -5.01%, the 5-year rate slightly improves at -3.03%.
| Time | Growth (%) |
|---|---|
| 3 years | -5.01% |
| 5 years | -3.03% |
The average dividend growth is -3.03% over 5 years. This shows a challenging scenario for potential future increases in dividend payments, indicating caution.
📉 Payout Ratio
The payout ratio helps to gauge the sustainability of dividend payments. With an EPS-based payout ratio of 202.20% and a free cash flow-based ratio of 138.49%, these high levels suggest pressure on future dividend sustainability.
| Key figure | Ratio (%) |
|---|---|
| EPS-based | 202.20% |
| Free cash flow-based | 138.49% |
The high EPS and FCF payout ratios signal potential risk to future dividend sustainability if profits or cash flows do not improve.
✅ Cashflow & Capital Efficiency
Strong cash flow metrics are crucial for sustaining dividend payments without relying on external financing. BXP's free cash flow yield is modest at 4.52%, while its operations demonstrate effective capital efficiency with a CAPEX to operating cash flow ratio of 60.93%.
| Year | Free Cash Flow Yield | Earnings Yield | CAPEX to Operating Cash Flow | Stock-based Compensation to Revenue | Free Cash Flow / Operating Cash Flow Ratio |
|---|---|---|---|---|---|
| 2025 | 6.42% | 2.58% | 44.61% | 0.00% | 55.39% |
| 2024 | 6.72% | 0.12% | 36.29% | 1.29% | 63.71% |
| 2023 | 7.43% | 1.72% | 37.06% | 1.57% | 62.94% |
Cash flow performance remains moderate, with a stable FCF to operating cash flow ratio, indicating fundamental operational efficiency.
⚠️ Balance Sheet & Leverage Analysis
Effective leverage management is essential to maintain financial stability. With a debt-to-equity ratio of 3.37 and a debt-to-assets ratio of 66.34%, leverage remains high, which could constrain financial flexibility.
| Year | Debt-to-Equity | Debt-to-Assets | Debt-to-Capital | Net Debt to EBITDA | Current Ratio | Quick Ratio | Financial Leverage |
|---|---|---|---|---|---|---|---|
| 2025 | 3.37 | 66.34% | 77.13% | 8.23 | 2.28 | 2.28 | 5.08 |
| 2024 | 3.20 | 66.41% | 76.19% | 9.93 | 2.56 | 2.56 | 4.82 |
| 2023 | 2.82 | 63.88% | 73.86% | 8.86 | 4.19 | 4.19 | 4.42 |
The high leverage indicates caution, as it might limit growth potential and dividend payouts during less favorable market conditions.
📈 Fundamental Strength & Profitability
Solid fundamentals and profitability levels underline a company's potential to generate returns. However, with ROE at 6.17% and a net margin of 7.95% in 2025, efficiency in converting revenue to profit could be enhanced.
| Year | Return on Equity | Return on Assets | Return on Invested Capital | Net Margin | EBIT Margin | EBITDA Margin | Gross Margin | R&D to Revenue |
|---|---|---|---|---|---|---|---|---|
| 2025 | 5.38% | 1.06% | 7.63% | 7.95% | 29.63% | 55.67% | 60.56% | 0% |
| 2024 | 0.26% | 0.05% | 4.01% | 0.42% | 21.40% | 47.50% | 61.20% | 0% |
| 2023 | 3.23% | 0.73% | 4.11% | 5.81% | 26.61% | 52.05% | 62.85% | 0% |
Returns on equity and margins have room for improvement, indicating the necessity for strategic operational enhancements to bolster profitability.
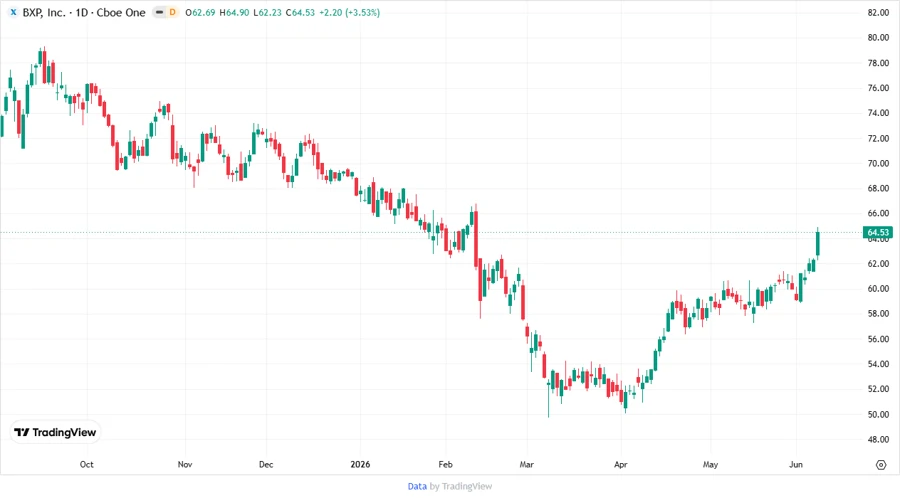
📉 Price Development
✅ Dividend Scoring System
| Category | Description | Score |
|---|---|---|
| Dividend Yield | ||
| Dividend Stability | ||
| Dividend Growth | ||
| Payout Ratio | ||
| Financial Stability | ||
| Dividend Continuity | ||
| Cashflow Coverage | ||
| Balance Sheet Quality |
Overall Score: 30 out of 40
🗣️ Rating
As BXP, Inc. navigates financial challenges reflected in its high payout ratios and leverage, the recommendation would be to approach with cautious optimism. While its dividend history is commendably long-standing, sustainability of future payments may depend on strategic financial management and improved profitability measures.
Smart Data Insight
Master the Perfect Entry & Exit for this Stock
Don't leave your profits to chance. Historically, this stock follows specific seasonal patterns that institutional traders use to maximize returns.
- ✅ Identify the "Golden Buying Window"
- ✅ Avoid high-risk correction cycles
- ✅ Backtested data from the last 20+ years