March 24, 2026 a 03:31 pm

BXP: Dividend Analysis - BXP, Inc.
BXP, Inc. presents a strong dividend profile with a 30-year history of consistent payments but recent growth challenges. With a current yield of 5.77% and payout ratios suggestive of overextension, prudent future management will be key. Stakeholders must interpret high payout relative to earnings critically, alongside its financial leverage.
📊 Overview
The following table provides an overview of key dividend metrics for BXP, Inc., reflecting its sector, yield, and dividend continuity.
| Metric | Value |
|---|---|
| Sector | Real Estate |
| Dividend Yield | 5.77% |
| Current Dividend per Share | 4.04 USD |
| Dividend History | 30 years |
| Last Cut or Suspension | None |
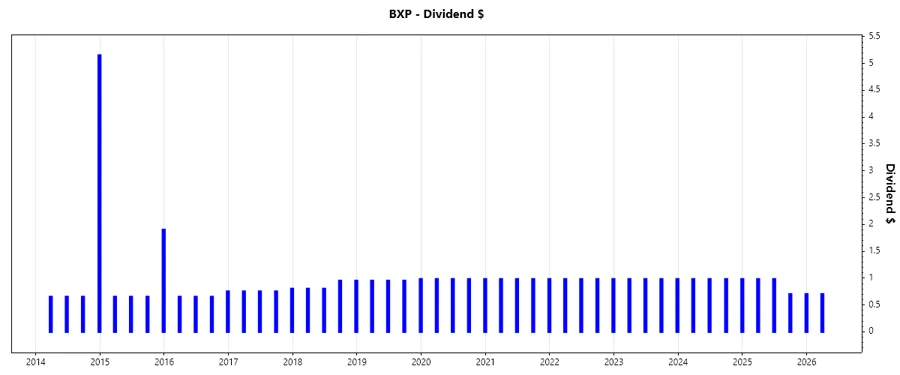
🗣️ Dividend History
BXP, Inc. has maintained its dividend payments for three decades, crucial for long-term investor confidence. Recent payments highlight consistent payouts, crucial for tracking shareholder value return trends.
| Year | Dividend per Share (USD) |
|---|---|
| 2026 | 0.70 |
| 2025 | 3.36 |
| 2024 | 3.92 |
| 2023 | 3.92 |
| 2022 | 3.92 |
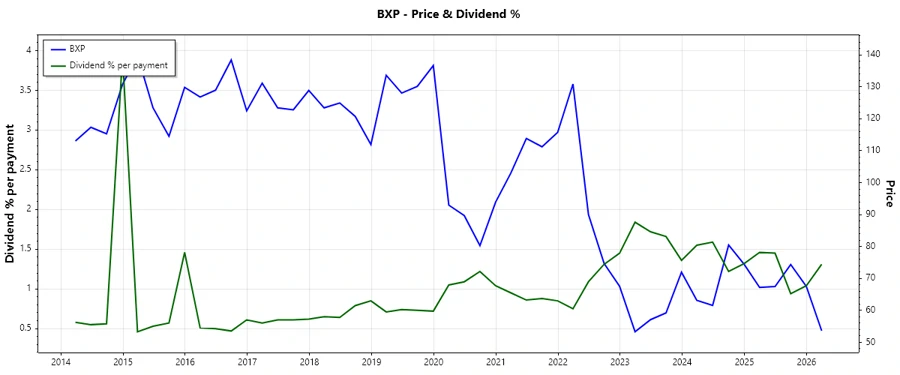
📈 Dividend Growth
Assessments reveal slight negative growth in dividends over recent years, with 3-year and 5-year compound growth rates indicating a rare decline not typical of robust dividend stocks. Monitoring is imperative.
| Time | Growth |
|---|---|
| 3 years | -5.01% |
| 5 years | -3.03% |
The average dividend growth is -3.03% over 5 years. This shows moderate but steady dividend growth challenges.
✅ Payout Ratio
Payout ratios illustrate BXP's distribution against earnings and cash flow. High ratios suggest a potential strain on future payouts given current financial commitments.
| Key figure | Ratio |
|---|---|
| EPS-based | 232.53% |
| Free cash flow-based | 92.98% |
The EPS payout ratio at 232.53% indicates payouts exceed earnings significantly, while FCF-based is more cautiously managed but still substantial.
📉 Cashflow & Capital Efficiency
With capital deployment, free cash flows are primary for assessing dividend sustainability. BXP exhibits moderate efficiency in capital allocation.
| Metric | 2025 | 2024 | 2023 |
|---|---|---|---|
| Free Cash Flow Yield | 6.42% | 6.72% | 7.43% |
| Earnings Yield | 2.58% | 0.12% | 1.72% |
| CAPEX to Operating Cash Flow | 44.61% | 36.29% | 37.06% |
| Stock-based Compensation to Revenue | 1.14% | 1.29% | 1.57% |
| Free Cash Flow / Operating Cash Flow Ratio | 55.39% | 63.71% | 62.94% |
Robust FCF yields signal sound cashflow management, pivotal amidst high dividends. Capital efficiency needs vigilance in sustaining reinvestment capabilities.
🛡️ Balance Sheet & Leverage Analysis
BXP's balance sheet displays substantial leverage, examined via debt ratios providing insight on financial stability and associated risks.
| Metric | 2025 | 2024 | 2023 |
|---|---|---|---|
| Debt-to-Equity | 3.37 | 3.20 | 2.82 |
| Debt-to-Assets | 66.34% | 66.41% | 63.88% |
| Debt-to-Capital | 77.13% | 76.19% | 73.86% |
| Net Debt to EBITDA | 8.19 | 9.93 | 8.86 |
| Current Ratio | 2.28 | 2.56 | 4.19 |
| Quick Ratio | 2.28 | 2.56 | 4.19 |
| Financial Leverage | 5.08 | 4.82 | 4.42 |
BXP's high leverage ratios suggest heightened risks amidst economic shifts; maintaining balance is crucial for long-term fiscal health.
💼 Fundamental Strength & Profitability
Profitability metrics highlight revenue efficiency, pivotal for competitive positioning. Assessing return metrics offers insights into operational effectiveness.
| Metric | 2025 | 2024 | 2023 |
|---|---|---|---|
| Return on Equity | 5.38% | 0.26% | 3.23% |
| Return on Assets | 1.06% | 0.05% | 0.73% |
| Net Margin | 7.95% | 0.42% | 5.81% |
| EBIT Margin | 29.63% | 21.40% | 26.61% |
| EBITDA Margin | 55.67% | 47.50% | 52.05% |
| Gross Margin | 60.56% | 61.20% | 62.85% |
| Research & Development to Revenue | 0% | 0% | 0% |
Consistent positive returns underscore BXP's operational strengths, though vigilance is advised given their competitive environment and zero R&D expenditure.
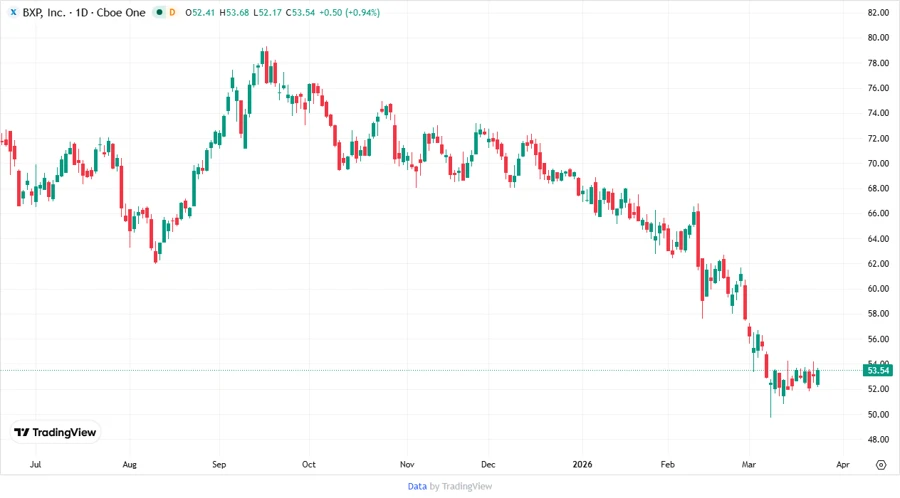
📈 Price Development
📊 Dividend Scoring System
| Criterion | Score | Score Bar |
|---|---|---|
| Dividend yield | 4 | |
| Dividend Stability | 3 | |
| Dividend growth | 2 | |
| Payout ratio | 2 | |
| Financial stability | 3 | |
| Dividend continuity | 5 | |
| Cashflow Coverage | 3 | |
| Balance Sheet Quality | 2 |
Total Score: 24/40
🔍 Rating
In summary, BXP, Inc. offers an attractive dividend yield with an established payment history, but wields a challenging payout ratio against earnings. Investors should weigh these factors, with caution around leverage and dividend growth prospects.
Smart Data Insight
Master the Perfect Entry & Exit for this Stock
Don't leave your profits to chance. Historically, this stock follows specific seasonal patterns that institutional traders use to maximize returns.
- ✅ Identify the "Golden Buying Window"
- ✅ Avoid high-risk correction cycles
- ✅ Backtested data from the last 20+ years