February 11, 2026 a 07:46 am
BXP: Dividend Analysis - BXP, Inc.
BXP, Inc., a leader in its sector, presents investors with a compelling opportunity despite its challenges. With a dividend yield of approximately 5%, the company has historically rewarded shareholders with a consistent income stream. However, recent years show a reduction in dividend growth, which may be attributed to internal operational adjustments. Understanding BXP's financial health and strategy is crucial for prospective investors.
📊 Overview
Analyzing BXP's dividend profile reveals a mixed snapshot of consistency and reduction. The impact of a dividend cut in 2025 suggests strategic restructuring.
| Sector | Dividend Yield | Current Dividend Per Share | Dividend History | Last Cut or Suspension |
|---|---|---|---|---|
| Real Estate | 4.98% | 3.64 USD | 29 years | 2025 |
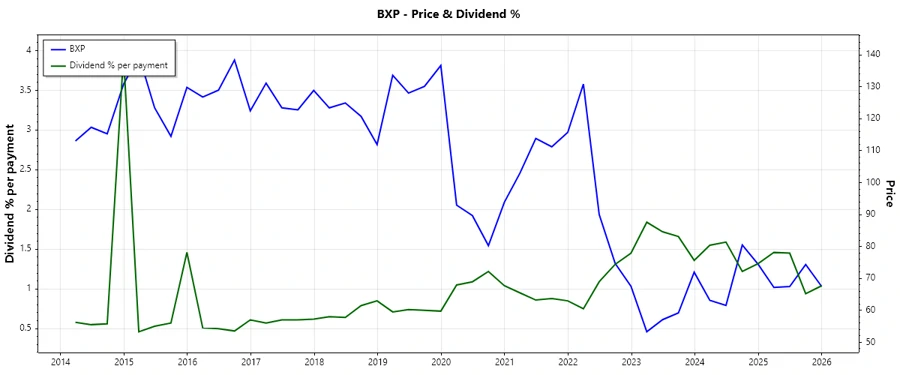
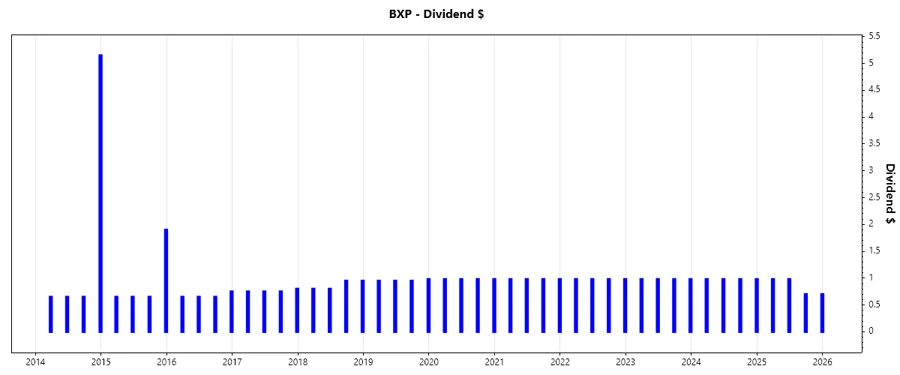
🗣️ Dividend History
BXP has a longstanding history of dividend payouts, showcasing its commitment to returning value to shareholders. Nonetheless, attention is required as there were reductions, affecting future profitability perceptions.
| Year | Dividend Per Share |
|---|---|
| 2025 | 3.36 USD |
| 2024 | 3.92 USD |
| 2023 | 3.92 USD |
| 2022 | 3.92 USD |
| 2021 | 3.92 USD |
📈 Dividend Growth
The decline in BXP's dividend growth is noteworthy, as it reflects shifts in company strategy or market pressures. Analysts should consider macroeconomic factors and management decisions.
| Time | Growth |
|---|---|
| 3 years | -5.01% |
| 5 years | -3.04% |
The average dividend growth is -3.04% over 5 years. This shows moderate but steady negative dividend growth.
📉 Payout Ratio
Payout ratios clarify the sustainability of dividends paid out of earnings or cash flow. A high payout ratio could signal potential financial distress if not managed.
| Key Figure | Ratio |
|---|---|
| EPS-based | 209.37% |
| Free cash flow-based | 136.51% |
The EPS payout ratio of 209.37% indicates that the company is paying out more than it earns, which could be unsustainable in the long run. Similarly, a 136.51% payout from free cash flow suggests over-extension.
✅ Cashflow & Capital Efficiency
Assessing BXP’s cash flow and capital efficiency is pivotal to understanding its financial health. Key metrics gauge operational cash coverage and capital investment efficiency.
| Year | 2025 | 2024 | 2023 |
|---|---|---|---|
| Free Cash Flow Yield | 0% | 6.72% | 7.43% |
| Earnings Yield | 2.58% | 0.12% | 1.72% |
| CAPEX to Operating Cash Flow | 0 | 36.29% | 37.06% |
| Stock-based Compensation to Revenue | 0 | 1.29% | 1.57% |
| Free Cash Flow / Operating Cash Flow Ratio | 0 | 63.71% | 62.94% |
| Return on Invested Capital | 7.63% | 4.01% | 4.11% |
Although periods show positive yields, a lack of consistent free cash flow yield in 2025 raises sustainability questions. Capital investments must be strategically analyzed.
⚠️ Balance Sheet & Leverage Analysis
BXP’s leverage ratios shed light on its financial obligations but warrant caution given high debt relative to equity and assets, indicating potential risks under rising interest rates.
| Year | 2025 | 2024 | 2023 |
|---|---|---|---|
| Debt-to-Equity | 337.25% | 320.03% | 282.49% |
| Debt-to-Assets | 66.34% | 66.41% | 63.88% |
| Debt-to-Capital | 77.13% | 76.19% | 73.86% |
| Net Debt to EBITDA | 8.18 | 9.93 | 8.86 |
| Current Ratio | 2.28 | 2.56 | 4.19 |
| Quick Ratio | 2.28 | 2.56 | 4.19 |
| Financial Leverage | 5.08 | 4.82 | 4.42 |
Excessive debt levels signal potential vulnerabilities, particularly with volatile interest coverage levels.
✅ Fundamental Strength & Profitability
Fundamentals highlight weak profitability and minimal returns on assets; continuing trends suggest strategic pivots are necessary for increased efficiency and shareholder value.
| Year | 2025 | 2024 | 2023 |
|---|---|---|---|
| Return on Equity | 5.38% | 0.26% | 3.23% |
| Return on Assets | 1.06% | 0.05% | 0.73% |
| Margins Net | 7.95% | 0.42% | 5.81% |
| EBIT Margin | 29.63% | 21.40% | 26.61% |
| EBITDA Margin | 55.67% | 47.50% | 52.05% |
| Gross Margin | 60.56% | 61.20% | 62.85% |
| Research & Development to Revenue | 0% | 0% | 0% |
While gross margins remain strong, low ROE and ROA imply a need for effective use of capital and exploration of growth avenues to improve fundamental strengths.
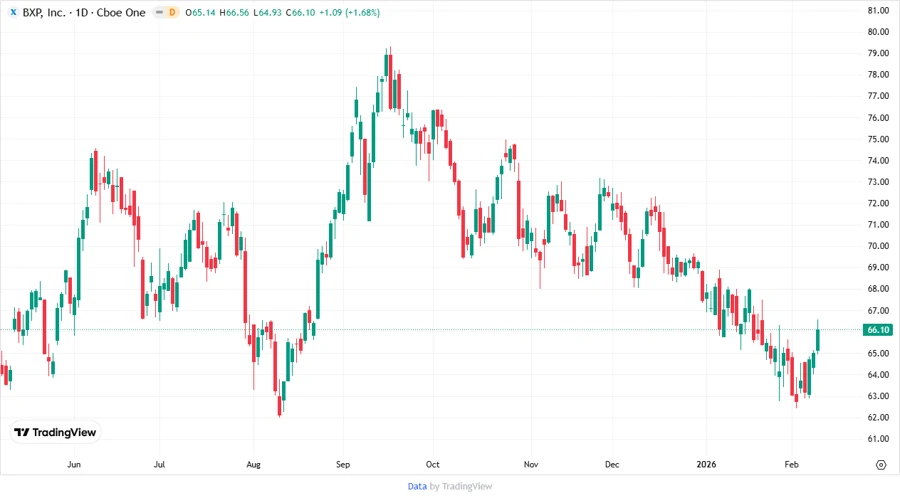
📊 Price Development
📜 Dividend Scoring System
| Criteria | Score | |
|---|---|---|
| Dividend yield | 4 | |
| Dividend Stability | 3 | |
| Dividend growth | 2 | |
| Payout ratio | 1 | |
| Financial stability | 2 | |
| Dividend continuity | 3 | |
| Cashflow Coverage | 2 | |
| Balance Sheet Quality | 2 |
Total Score: 19/40
✅ Rating
Given BXP's current dividend efficiency and financial metrics, it is rated as "Under Review" due to uncertainties in payout sustainability and financial leverage. Investors should monitor future strategic shifts for potential recovery and growth stability.
Smart Data Insight
Master the Perfect Entry & Exit for this Stock
Don't leave your profits to chance. Historically, this stock follows specific seasonal patterns that institutional traders use to maximize returns.
- ✅ Identify the "Golden Buying Window"
- ✅ Avoid high-risk correction cycles
- ✅ Backtested data from the last 20+ years