January 12, 2026 a 12:46 pm

BXP: Dividend Analysis - BXP, Inc.
BXP, Inc. presents a robust dividend yield in its sector, attracting income-focused investors. However, recent fluctuations in dividend growth and high payout ratios could pose challenges in terms of sustainability and financial health.
📊 Overview
BXP, Inc. operates within a specific sector, providing context for its dividend yield and financial commitments.
| Key Metrics | Data |
|---|---|
| Sector | REITs |
| Dividend Yield | 4.98 % |
| Current Dividend per Share | 4.38 USD |
| Dividend History | 29 years |
| Last Cut or Suspension | 2025 |
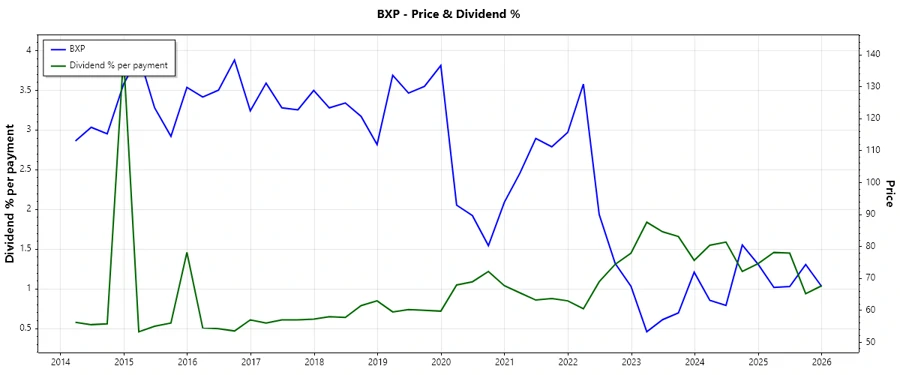
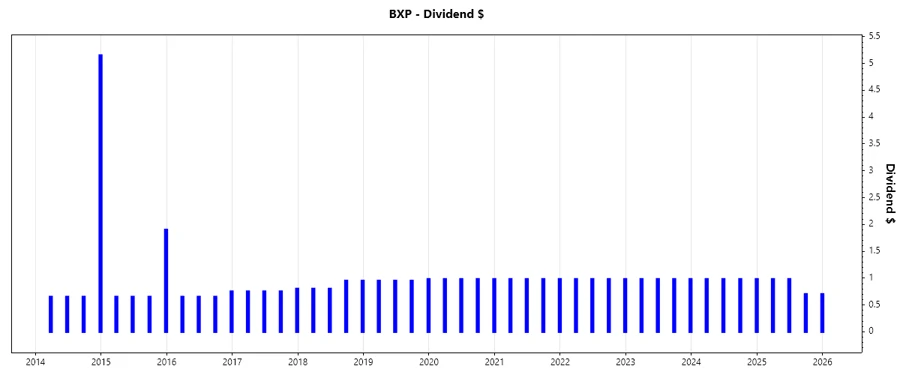
📈 Dividend History
Understanding the dividend history provides insights into the company's commitment to sharing profits with shareholders. A stable or increasing history can signal financial health, whereas decreases can indicate financial stress.
| Year | Dividend per Share (USD) |
|---|---|
| 2025 | 3.36 |
| 2024 | 3.92 |
| 2023 | 3.92 |
| 2022 | 3.92 |
| 2021 | 3.92 |
📉 Dividend Growth
Analyzing dividend growth over various periods provides a perspective on potential future increases and the company's profitability trends.
| Time | Growth |
|---|---|
| 3 years | -5.01 % |
| 5 years | -3.03 % |
The average dividend growth is -3.03 % over 5 years. This indicates a moderate decrease, prompting caution among investors who seek steady growth.
✅ Payout Ratio
Payout ratios are critical indicators of dividend sustainability. They reflect what portion of earnings is returned to shareholders as dividends and impacts future payout capabilities.
| Key Figure Ratio | Value |
|---|---|
| EPS-based | -346.14 % |
| Free Cash Flow-based | 105.90 % |
The payout ratios suggest potential challenges, as an EPS-based ratio of -346.14% is unsustainable, while the FCF-based ratio at 105.90% exceeds typical comfort levels, indicating cash flow constraints.
⚠️ Cashflow & Capital Efficiency
Evaluating cashflow and capital efficiency metrics gives insights into a firm's operational proficiency and potential for dividend coverage from operating cash flow.
| Year | 2024 | 2023 | 2022 |
|---|---|---|---|
| Free Cash Flow Yield | 10.54% | 11.80% | 8.34% |
| Earnings Yield | 0.12% | 1.72% | 8.01% |
| CAPEX to Operating Cash Flow | 46.32% | 37.06% | 31.04% |
| Stock-based Compensation to Revenue | 1.27% | 0.00% | 1.67% |
| Free Cash Flow / Operating Cash Flow Ratio | 100% | 100% | 68.96% |
The cash flow data reflects mixed operational efficiency. While free cash flow yield is healthy, high CAPEX denotes significant reinvestment requirements.
🗣️ Balance Sheet & Leverage Analysis
An analysis of leverage metrics aids in understanding the financial stability and debt servicing capacity of the company, impacting its risk profile.
| Year | 2024 | 2023 | 2022 |
|---|---|---|---|
| Debt-to-Equity | 3.20 | 2.82 | 2.40 |
| Debt-to-Assets | 66.41% | 63.88% | 60.70% |
| Debt-to-Capital | 76.19% | 73.86% | 70.55% |
| Net Debt to EBITDA | 9.93 | 8.86 | 6.34 |
| Current Ratio | 2.56 | 4.19 | 3.16 |
| Quick Ratio | 2.56 | 4.19 | 3.16 |
| Financial Leverage | 4.82 | 4.42 | 3.95 |
This high level of debt suggests potential vulnerabilities, particularly in less favorable financial conditions. Strong liquidity metrics, such as a high current ratio, mitigate some risks.
📈 Fundamental Strength & Profitability
Key profitability ratios give perspective on the company's ability to generate profits relative to equity and assets, critical for long-term investments.
| Year | 2024 | 2023 | 2022 |
|---|---|---|---|
| Return on Equity | 0.26% | 3.23% | 13.84% |
| Return on Assets | 0.05% | 0.73% | 3.51% |
| Margins: Net | 0.42% | 5.81% | 27.31% |
| Margins: EBIT | 21.40% | 26.60% | 46.89% |
| Margins: EBITDA | 47.50% | 52.05% | 71.09% |
| Margins: Gross | 61.20% | 62.85% | 63.47% |
Performance metrics indicate inconsistent profitability, with margins fluctuating considerably over the provided years, posing potential risk to stability.
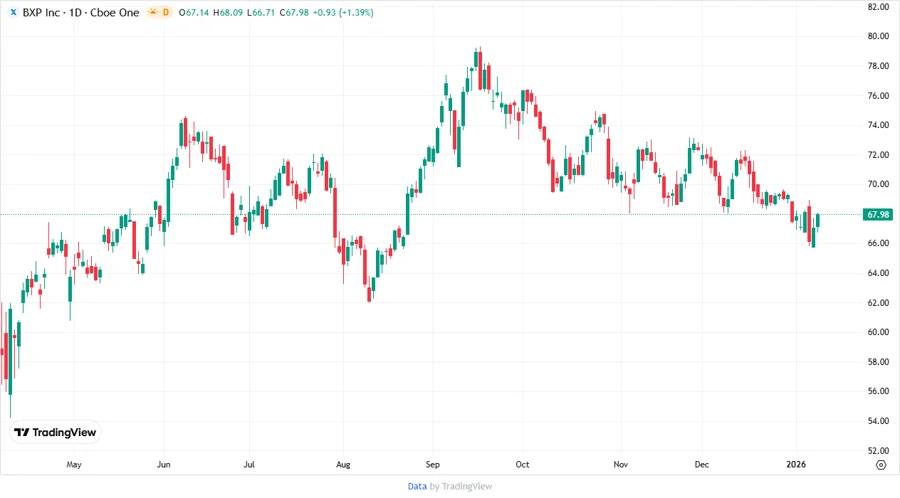
📊 Price Development
🗒️ Dividend Scoring System
| Criteria | Score | Score Bar |
|---|---|---|
| Dividend Yield | 4 | |
| Dividend Stability | 2 | |
| Dividend Growth | 1 | |
| Payout Ratio | 2 | |
| Financial Stability | 3 | |
| Dividend Continuity | 2 | |
| Cashflow Coverage | 3 | |
| Balance Sheet Quality | 3 |
Overall Score: 20/40
🟢 Rating
In summary, BXP's dividend profile indicates some strengths such as a robust yield, but notable weaknesses in growth and sustainability present risks. Cautious optimism is advised for income-focused investors considering BXP as part of a diversified portfolio.