October 21, 2025 a 02:46 am

BXP: Dividend Analysis - BXP, Inc.
BXP, Inc. presents an intriguing dividend profile for income-focused investors. With a dividend yield close to 5%, it exceeds industry averages, although growth has been stagnant. The historical consistency of their dividend payments over 29 years underlines a reliable commitment to shareholder returns. Despite a troubling payout ratio from EPS indicating sustainability concerns, there's a sound history of stability.
📊 Overview
The following table outlines BXP's dividend specifics, providing a snapshot of current figures and historical patterns of dividend activity.
| Aspect | Details |
|---|---|
| Sector | Real Estate |
| Dividend Yield | 4.90% |
| Current Dividend Per Share | 4.38 USD |
| Dividend History | 29 years |
| Last Cut or Suspension | None |
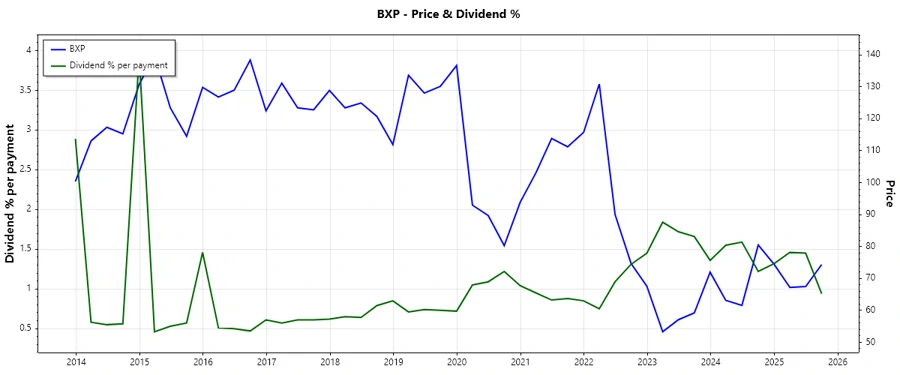
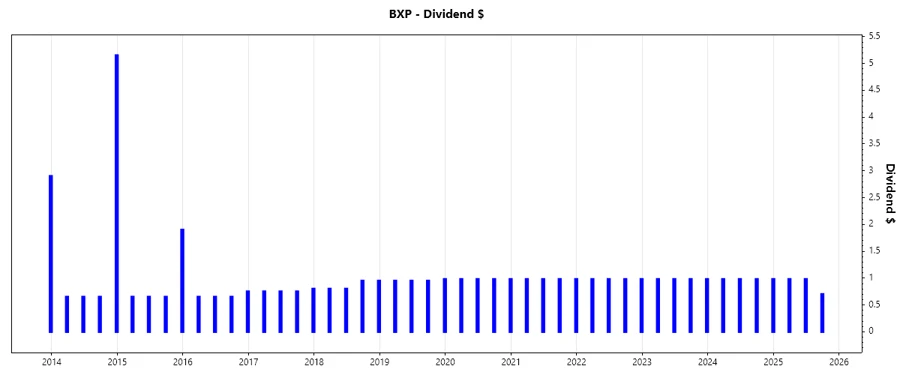
🗣️ Dividend History
BXP's long-standing dividend history is a testament to its consistent payout strategy over nearly three decades. A long history without cuts indicates a solid cash flow strategy and prioritization of investor returns, even in fluctuating market conditions.
| Year | Dividend Per Share (USD) |
|---|---|
| 2025 | 2.66 |
| 2024 | 3.92 |
| 2023 | 3.92 |
| 2022 | 3.92 |
| 2021 | 3.92 |
📈 Dividend Growth
Understanding dividend growth is crucial for assessing potential future value. BXP's recent dividend growth has been relatively static but shows slight development over a five-year horizon.
| Timeframe | Growth |
|---|---|
| 3 Years | 0% |
| 5 Years | 0.47% |
The average dividend growth is 0.47% over 5 years. This shows moderate but steady dividend growth.
✅ Payout Ratio
The payout ratio is a critical measure of dividend sustainability. BXP exhibits a concerningly high EPS-based payout ratio, underscoring potential challenges in maintaining current dividend levels if earnings do not increase.
| Key Figure | Ratio |
|---|---|
| EPS-based | 14064.24% |
| Free Cash Flow-based | 98.99% |
The extraordinarily high EPS-based payout ratio suggests unsustainable distributions if income performance does not improve, while the FCF-based ratio indicates all current free cash is being returned as dividends.
📉 Cashflow & Capital Efficiency
Evaluating cash flow efficiency is pivotal for understanding a company's ability to sustain dividends long-term. Key ratios here highlight how cash is generated and utilized.
| Metric | 2024 | 2023 | 2022 |
|---|---|---|---|
| Free Cash Flow Yield | 10.54% | 11.80% | 8.35% |
| Earnings Yield | 0.12% | 1.72% | 8.02% |
| CAPEX to Operating Cash Flow | 43.15% | 37.06% | 31.04% |
| Stock Compensation to Revenue | 1.28% | 0.00% | 1.67% |
| Free Cash Flow / Operating Cash Flow Ratio | 100% | 100% | 69% |
| Return on Invested Capital | 4.01% | 3.93% | 2.50% |
The cash flow ratios, particularly the free cash flow yields, reflect a reasonable ability to generate cash. However, the allocation of capital suggests a potential strain on growth investments.
⚠️ Balance Sheet & Leverage Analysis
A strong balance sheet with manageable leverage ratios is essential for dividend security. BXP's metrics below provide insights into its financial health and debt management prowess.
| Metric | 2024 | 2023 | 2022 |
|---|---|---|---|
| Debt-to-Equity | 3.14 | 2.83 | 2.40 |
| Debt-to-Assets | 65.11% | 63.88% | 60.70% |
| Debt-to-Capital | 75.83% | 73.88% | 70.55% |
| Net Debt to EBITDA | 10.57 | 8.86 | 7.76 |
| Current Ratio | 1.32 | 0 | 0 |
| Quick Ratio | 2.56 | 4.19 | 3.16 |
| Financial Leverage | 4.82 | 4.43 | 3.95 |
Higher leverage suggests risk in debt management, demanding careful observation for potential restructurings to ensure liquidity and balance sheet resilience.
✅ Fundamental Strength & Profitability
Profitability metrics offer a lens into the company's ability to generate returns. BXP's figures indicate varying efficiency and profitability ratios over the past three years.
| Metric | 2024 | 2023 | 2022 |
|---|---|---|---|
| Return on Equity | 0.26% | 3.24% | 13.84% |
| Return on Assets | 0.05% | 0.73% | 3.51% |
| Net Margin | 0.42% | 5.81% | 27.31% |
| EBIT Margin | 29.96% | 26.61% | 33.97% |
| EBITDA Margin | 55.99% | 52.05% | 58.09% |
| Research & Development to Revenue | 0% | 0% | 0% |
While profitability has shown fluctuation, the emphasis on maintaining robust EBITDA margins implies operational resilience, albeit with limited growth in equity returns due to elevated costs or inefficiencies.
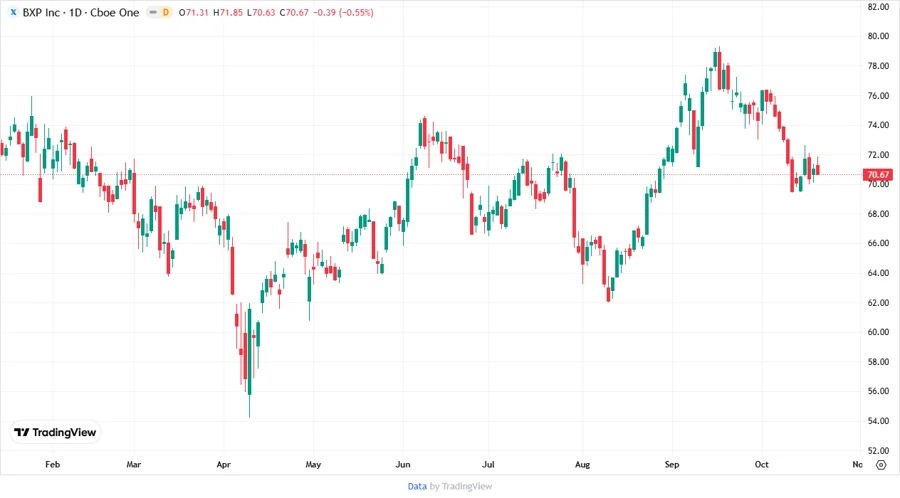
📉 Price Development
📊 Dividend Scoring System
This scoring system grades several critical dividend facets, breaking down financial performance into a quantitative framework.
| Category | Score (1-5) | Visual Representation |
|---|---|---|
| Dividend Yield | 4 | |
| Dividend Stability | 4 | |
| Dividend Growth | 2 | |
| Payout Ratio | 2 | |
| Financial Stability | 3 | |
| Dividend Continuity | 5 | |
| Cashflow Coverage | 3 | |
| Balance Sheet Quality | 3 |
Total Score: 26/40
Rating
BXP, Inc. receives a comprehensive dividend rating of moderate stability, with cautions noted in its payout sustainability due to high EPS-based allocations. While it offers appealing current yields and robust dividend continuity, growth and high payout rates pose risks. Investors are advised to consider these factors within their risk appetite. Overall, BXP stands as a viable income-generating option, albeit with some caveats.