
July 19, 2026 a 05:15 am
BSX: Fibonacci Analysis - Boston Scientific Corporation
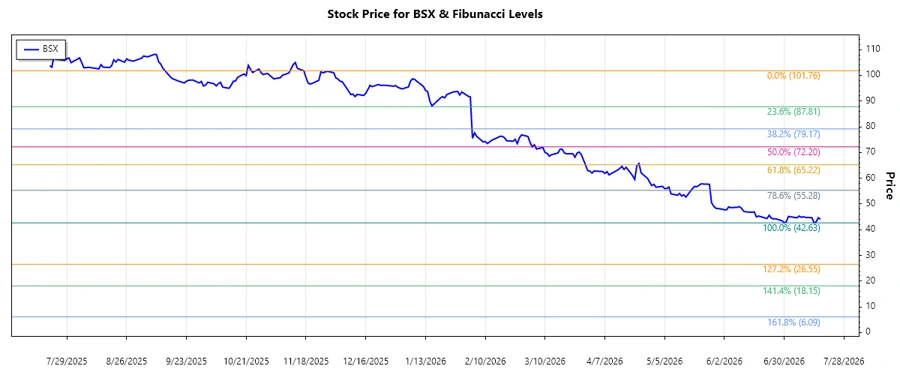
The stock performance of Boston Scientific has shown a significant downtrend over the analyzed period. From the start price of $101.76 on November 17, 2025, the stock witnessed a continuous decrease, reaching a low of $42.63 on July 14, 2026. This analysis highlights key retracement levels which offer insight into potential price reversals or continuations in the context of Boston Scientific's broad business in medical technology.
Fibonacci Analysis
| Detail | Value |
|---|---|
| Start Date | 2025-11-17 |
| End Date | 2026-07-14 |
| High Price | $101.76 (2025-11-17) |
| Low Price | $42.63 (2026-07-14) |
| Fibonacci 0.236 | Price: $57.76 |
| Fibonacci 0.382 | Price: $65.18 |
| Fibonacci 0.5 | Price: $72.2 |
| Fibonacci 0.618 | Price: $79.21 |
| Fibonacci 0.786 | Price: $89.08 |
| Current Price | $44.03 |
| Retracement Zone | none |
| Interpretation | The current price is below the Fibonacci retracement levels, indicating potential further downside or consolidation before any significant reversal. |
Conclusion
The current technical analysis of Boston Scientific Corporation's stock suggests that the stock is in the midst of a prolonged downtrend. Despite this decline, the company operates in a robust sector with innovative product lines, which may offer long-term investment opportunities once market conditions stabilize. Investors should exercise caution, however, as the stock trades significantly below key retracement levels, signaling that further declines are possible. A close watch on upcoming earnings and market developments will be crucial for timing any potential entry or exit points.
Smart Data Insight
Master the Perfect Entry & Exit for this Stock
Don't leave your profits to chance. Historically, this stock follows specific seasonal patterns that institutional traders use to maximize returns.
- ✅ Identify the "Golden Buying Window"
- ✅ Avoid high-risk correction cycles
- ✅ Backtested data from the last 20+ years