June 14, 2026 a 05:15 am

BSX: Fibonacci Analysis - Boston Scientific Corporation
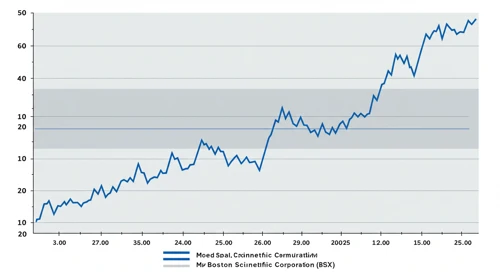
Boston Scientific Corporation (BSX) has experienced significant fluctuations in its stock price over recent months. With expertise in medical technology, the company's wide-ranging innovations position it as a strong contender in the market. Current data suggests a potential for growth after a recent downward trend. Understanding Fibonacci retracement levels in this context can provide insights into potential points of support or resistance.
Fibonacci Analysis
| Detail | Information | ||||||||||||
|---|---|---|---|---|---|---|---|---|---|---|---|---|---|
| Trend Period | 2025-06-16 to 2026-06-12 | ||||||||||||
| High Price | $108.14 (2025-09-08) | ||||||||||||
| Low Price | $46.91 (2026-06-12) | ||||||||||||
| Fibonacci Levels |
|
||||||||||||
| Current Price Position | The price is below the 0.236 retracement level, indicating it is not currently in a Fibonacci retracement zone. | ||||||||||||
| Technical Interpretation | The current price suggests potential resistance at levels closer to $62.69 and below. |
Conclusion
The stock of Boston Scientific Corporation has shown a downward trend over the last period, with the potential for regaining ground as indicated by Fibonacci levels. Analysts should watch for price movement towards key retracement levels, which could signal potential reversal points or continued resistance. Risks lie in breaking the resistance levels, while opportunities exist in leveraging the company's innovative strength if positive market sentiment returns. Monitoring macroeconomic factors impacting the medical technology sector will also be crucial in gauging future performance.
Smart Data Insight
Master the Perfect Entry & Exit for this Stock
Don't leave your profits to chance. Historically, this stock follows specific seasonal patterns that institutional traders use to maximize returns.
- ✅ Identify the "Golden Buying Window"
- ✅ Avoid high-risk correction cycles
- ✅ Backtested data from the last 20+ years