March 11, 2026 a 11:44 am

BSX: Fibonacci Analysis - Boston Scientific Corporation
Boston Scientific Corporation has experienced a pronounced downward trend over the past months with notable price declines. The company, operating within the medical devices sector, faces both market challenges and opportunities that may influence its stock performance. Understanding its recent price movements and technical indicators such as Fibonacci retracement could offer insights for potential investment strategies.
Fibonacci Analysis
| Analysis Information | Details |
|---|---|
| Start Date | 2025-11-13 |
| End Date | 2026-03-10 |
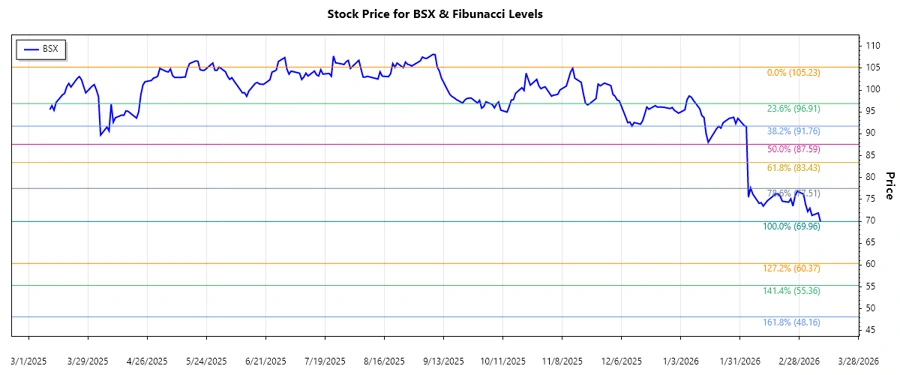
| High Point | $105.23 on 2025-09-10 |
| Low Point | $69.96 on 2026-03-10 |
Fibonacci Levels
| Retracement Level | Price |
|---|---|
| 0.236 | $78.59 |
| 0.382 | $83.28 |
| 0.5 | $87.60 |
| 0.618 | $91.92 |
| 0.786 | $97.55 |
The current price of $69.96 is below the lowest Fibonacci retracement level of 0.236 at $78.59. This suggests that the stock is currently experiencing a strong bearish momentum. The stock is not within any retracement zone, indicating the potential absence of immediate support levels.
Conclusion
Boston Scientific Corporation faces a challenging period with its stock price in a steady downtrend over recent months. The technical analysis indicates that significant effort will be needed to regain bullish momentum, especially given the breach of key Fibonacci levels. Investors should be cautious and monitor closely for any potential changes in market sentiment or fundamental developments. In the short term, the current technical structure suggests limited upside potential unless reversals are supported by new catalysts.