August 05, 2025 a 09:03 am**BRO: Trend and Support & Resistance Analysis - Brown & Brown, Inc.**

BRO: Trend and Support & Resistance Analysis - Brown & Brown, Inc.
The stock of Brown & Brown, Inc., listed under the ticker BRO, has shown recent volatility due to various economic conditions impacting the insurance industry. With a diverse range of services across multiple countries, the company remains a significant player in the sector. Current technical indicators show potential areas of interest for investors. A detailed analysis of the recent price action reveals a notable trend shift with key support and resistance zones identified.
Trend Analysis
The analysis of Brown & Brown, Inc. (BRO) indicates recent price adjustments impacted by market dynamics. Over the last several months, the stock has experienced fluctuations that reveal a nuanced trend. By calculating the Exponential Moving Averages (EMAs), we assess the trend direction. With EMA20 compared to EMA50:
- EMA20 > EMA50 → ▲ Uptrend
- EMA20 < EMA50 → ▼ Downtrend
- EMA20 ≈ EMA50 → ⚖️ Sideways Trend
| Date | Closing Price | Trend |
|---|---|---|
| 2025-08-04 | 92.7 | ▼ |
| 2025-08-01 | 92.24 | ▼ |
| 2025-07-31 | 91.37 | ▼ |
| 2025-07-30 | 92.94 | ▼ |
| 2025-07-29 | 91.91 | ▼ |
| 2025-07-28 | 102.58 | ▼ |
| 2025-07-25 | 103.38 | ▼ |
Technical analysis indicates a downtrend in the recent data, as EMA20 remains beneath EMA50, suggesting selling pressure. Investors should monitor changes for any reversal signs.
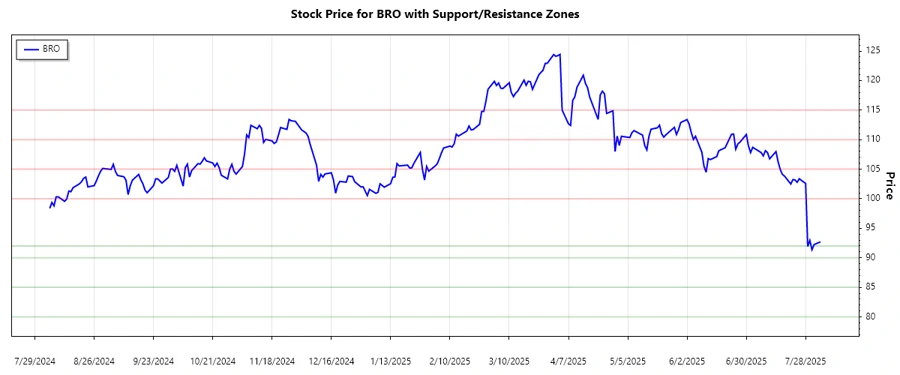
Support and Resistance
| Zone | Range | Direction |
|---|---|---|
| Support Zone 1 | 90.00 - 92.00 | ▼ |
| Support Zone 2 | 80.00 - 85.00 | ▼ |
| Resistance Zone 1 | 100.00 - 105.00 | ▲ |
| Resistance Zone 2 | 110.00 - 115.00 | ▲ |
The current price position suggests it is within the support zone 1 range, indicating potential stabilization. Resistance levels present upward challenges, highlighting significant pressures above.
Conclusion
The recent analysis of Brown & Brown, Inc. (BRO) underlines a prominent downtrend, influenced by market volatility and industry dynamics. Positioned within a crucial support zone, the stock may present a stabilization point, offering opportunities but mandating caution. Resistance levels indicate significant selling pressure above, poised to challenge upward movements. The integration of EMAs suggests persistent downward pressure, requiring consistent monitoring for trend reversals or consolidations. Analysts should remain alert to updates in regulatory and economic landscapes that can impact broader sectoral performance.
Smart Data Insight
Master the Perfect Entry & Exit for this Stock
Don't leave your profits to chance. Historically, this stock follows specific seasonal patterns that institutional traders use to maximize returns.
- ✅ Identify the "Golden Buying Window"
- ✅ Avoid high-risk correction cycles
- ✅ Backtested data from the last 20+ years