
July 14, 2026 a 01:00 pm
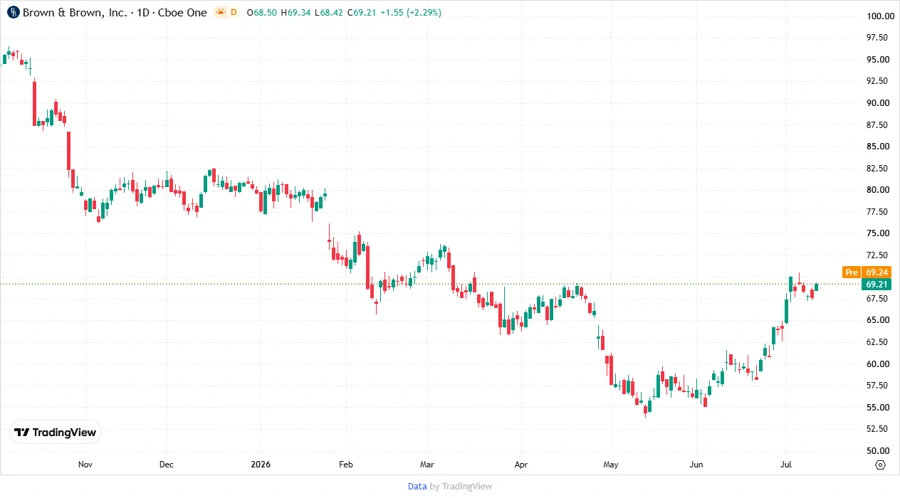
BRO: Fundamental Ratio Analysis - Brown & Brown, Inc.
Brown & Brown, Inc. presents a solid investment opportunity with a stable business model in the insurance brokerage industry. Despite challenges in the financial services sector, the company shows resilience with a diversified range of services. Analyzing its fundamental metrics, it remains a significant player within its industry.
Fundamental Rating
BRO shows a mixed but stable set of fundamentals, with strengths in discounted cash flow while facing challenges in debt management.
| Category | Score | Visualization |
|---|---|---|
| Discounted Cash Flow | 5 | |
| Return on Equity | 3 | |
| Return on Assets | 4 | |
| Debt to Equity | 2 | |
| Price to Earnings | 2 | |
| Price to Book | 2 |
Historical Rating
The historical analysis indicates stability in the scoring metrics over time, with consistent performance across key financial areas.
| Date | Overall Score | DCF | ROE | ROA | Debt to Equity | P/E | P/B |
|---|---|---|---|---|---|---|---|
| 2026-07-13 | 3 | 5 | 3 | 4 | 2 | 2 | 2 |
| Past Date | 3 | 5 | 3 | 4 | 2 | 2 | 2 |
Analysts' Price Targets
The target price analysis provides a consolidated view with uniform price targets across different analysts.
| High | Low | Median | Consensus |
|---|---|---|---|
| 55 | 55 | 55 | 55 |
Analysts' Sentiments
The sentiment table reveals a cautious market approach, with a majority holding stance.
| Recommendation | Number | Visualization |
|---|---|---|
| Strong Buy | 0 | |
| Buy | 11 | |
| Hold | 19 | |
| Sell | 1 | |
| Strong Sell | 0 |
The investment outlook for Brown & Brown, Inc. is balanced, with strengths in its operational performance and diversification. However, areas like debt management could be improved for a stronger financial posture. The consistent historical performance and stable analyst ratings contribute positively, though a watchful approach on debt metrics is advised. The steady consensus in analyst sentiment suggests a stable market expectation.
Smart Data Insight
Master the Perfect Entry & Exit for this Stock
Don't leave your profits to chance. Historically, this stock follows specific seasonal patterns that institutional traders use to maximize returns.
- ✅ Identify the "Golden Buying Window"
- ✅ Avoid high-risk correction cycles
- ✅ Backtested data from the last 20+ years