July 05, 2025 a 06:00 pm

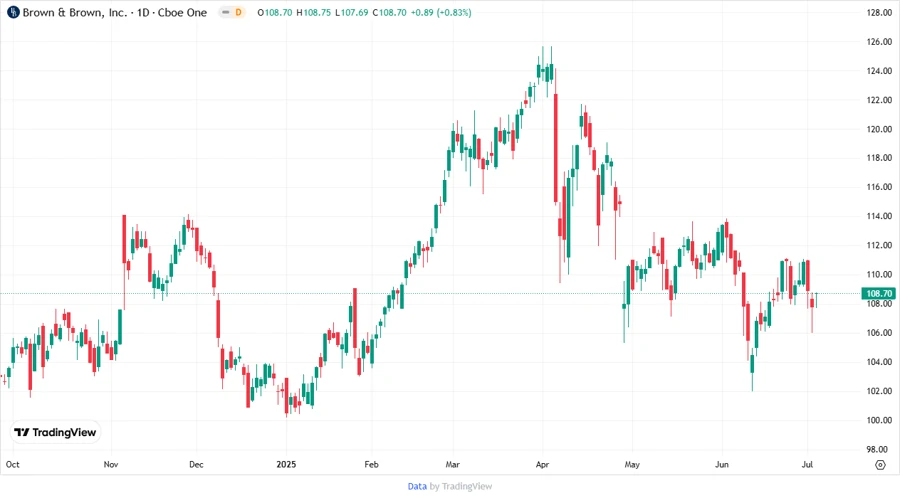
BRO: Fundamental Ratio Analysis - Brown & Brown, Inc.
Brown & Brown, Inc. operates in a diverse range of insurance segments, demonstrating strength in its retail and national programs. Despite some debt-to-equity challenges, the firm maintains solid cash flow and asset returns. Analysts currently classify the stock as a "Hold".
Fundamental Rating
The fundamental rating of Brown & Brown, Inc. is solid but not without weaknesses. Key strengths include discounted cash flow and returns on equity and assets.
| Category | Score | Visualization |
|---|---|---|
| Discounted Cash Flow | 4 | |
| Return on Equity | 4 | |
| Return on Assets | 4 | |
| Debt to Equity | 2 | |
| Price to Earnings | 1 | |
| Price to Book | 1 |
Historical Rating
The historical performance indicates stable returns with some variations noted over time.
| Date | Overall | DCF | ROE | ROA | DebtToEquity | P/E | P/B |
|---|---|---|---|---|---|---|---|
| 2025-07-03 | 3 | 4 | 4 | 4 | 2 | 1 | 1 |
| Previous | 0 | 4 | 4 | 4 | 2 | 1 | 1 |
Analyst Price Targets
Price targets suggest moderate optimism, with the consensus pointing to a "Hold".
| High | Low | Median | Consensus |
|---|---|---|---|
| $116 | $62 | $99 | $93.3 |
Analyst Sentiment
The sentiment among analysts shows a balance between Buy and Hold recommendations, with very few suggesting a Sell.
| Recommendation | Number | Distribution |
|---|---|---|
| Strong Buy | 0 | |
| Buy | 13 | |
| Hold | 14 | |
| Sell | 1 | |
| Strong Sell | 0 |
Conclusion
Brown & Brown, Inc. has a strong presence in the insurance market with diverse operational segments. While the stock displays solid cash flow and asset performance, challenges persist with its valuation ratios. Analyst sentiment is neutral to positive, with most agreeing on a Hold. Future prospects depend on balance sheet improvements and capturing growth in emerging markets. Continued focus on core areas and managing debt levels effectively will be key in enhancing investor confidence.
Smart Data Insight
Master the Perfect Entry & Exit for this Stock
Don't leave your profits to chance. Historically, this stock follows specific seasonal patterns that institutional traders use to maximize returns.
- ✅ Identify the "Golden Buying Window"
- ✅ Avoid high-risk correction cycles
- ✅ Backtested data from the last 20+ years