May 10, 2026 a 11:31 am


BRO: Dividend Analysis - Brown & Brown, Inc.
Brown & Brown, Inc. maintains a consistent dividend policy with a solid history of 40 years of payments, showcasing its commitment to returning value to shareholders. The current dividend yield stands at a modest 1.14%, and despite its low payout ratio, the company enjoys a healthy cash flow position, allowing for sustainable dividend practices. The lack of recent cuts or suspensions further underscores its stability as a dividend-paying entity, positioning BRO as a reliable long-term investment for income-seeking investors.
📊 Overview
Brown & Brown, Inc., a prominent player in the insurance brokerage sector, boasts a remarkable consistency in dividend payouts over the past 40 years. With a current dividend yield of 1.14%, it prioritizes maintaining shareholder trust through dependable returns. The current annual dividend per share is $0.63, with no historical cuts or suspensions, affirming its strong dividend reliability.
| Metric | Details |
|---|---|
| Sector | Insurance Brokerage |
| Dividend Yield | 1.14% |
| Current Dividend per Share | $0.63 |
| Dividend History | 40 years |
| Last Cut or Suspension | None |
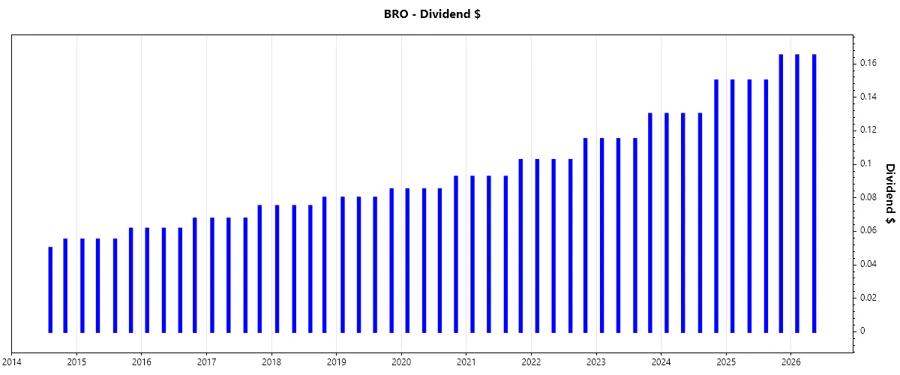
🗣️ Dividend History
The dividend history of Brown & Brown, Inc. demonstrates unwavering consistency, a key indicator of fiscal health and commitment to shareholder returns. This stability is particularly vital for income investors. The recent dividend trajectory emphasizes steady, incremental growth, reflective of the company's robust cash generation capabilities.
| Year | Dividend per Share (USD) |
|---|---|
| 2026 | 0.330 |
| 2025 | 0.615 |
| 2024 | 0.540 |
| 2023 | 0.475 |
| 2022 | 0.4225 |
📈 Dividend Growth
Understanding dividend growth is crucial as it signals a company's financial health and capability of increasing shareholder returns over time. Brown & Brown's average dividend growth of approximately 13.33% over the past three years and 12.09% over the past five years signifies a steady and promising increase in payouts.
| Time | Growth |
|---|---|
| 3 years | 13.33% |
| 5 years | 12.09% |
The average dividend growth is 12.09% over 5 years. This shows moderate but steady dividend growth.
✅ Payout Ratio
The payout ratio is a critical measure of dividend sustainability. Brown & Brown, Inc.'s low EPS-based payout ratio of 18.15% and FCF-based payout ratio of 14.38% suggest ample room for dividend growth. These figures indicate a prudent approach by the company in maintaining a balanced reinvestment and payout strategy.
| Key Figure | Ratio |
|---|---|
| EPS-based | 18.15% |
| Free Cash Flow-based | 14.38% |
The low payout ratios indicate a conservative distribution approach, which supports the potential for future dividend growth while safeguarding financial health.
⚠️ Cashflow & Capital Efficiency
Cash flow analysis reveals how well a company can cover its obligations, fund dividends, and facilitate growth without external financing. Brown & Brown has demonstrated robust capital efficiency with a free cash flow yield of 7.71% and an exceptionally high free cash flow to operating cash flow ratio of 95.31%. This suggests efficient operations with substantial cash generation capabilities.
| Year | 2025 | 2024 | 2023 |
|---|---|---|---|
| Free Cash Flow Yield | 5.59% | 3.80% | 4.71% |
| Earnings Yield | 4.27% | 3.45% | 4.36% |
| CAPEX to Operating Cash Flow | 4.69% | 6.98% | 6.83% |
| Stock-based Compensation to Revenue | 1.56% | 2.15% | 2.12% |
| Free Cash Flow / Operating Cash Flow Ratio | 95.31% | 93.02% | 93.17% |
The strong cash flow indicators reflect a solid foundation for maintaining shareholder distributions and investments in growth strategies.
💪 Balance Sheet & Leverage Analysis
The balance sheet metrics provide insights into the financial stability and leverage level, crucial for assessing long-term sustainability and risks. Brown & Brown's prudent debt management is reflected in its healthy debt-to-equity ratio of 0.63 and net debt to EBITDA ratio at 3.26. These indicate manageable leverage and an ability to meet its financial commitments.
| Year | 2025 | 2024 | 2023 |
|---|---|---|---|
| Debt-to-Equity | 0.63 | 0.63 | 0.72 |
| Debt-to-Assets | 0.26 | 0.23 | 0.27 |
| Debt-to-Capital | 0.39 | 0.39 | 0.42 |
| Net Debt to EBITDA | 3.26 | 1.96 | 2.14 |
| Current Ratio | --- | --- | 1.035 |
| Quick Ratio | 1.039 | 1.097 | 1.035 |
| Financial Leverage | 2.39 | 2.74 | 2.67 |
The leverage statistics affirm the company's resilience and sound debt management practices, aiding its long-term fiscal sustainability.
🏆 Fundamental Strength & Profitability
Fundamental indicators reveal the profitability and operational efficiency of a company. Brown & Brown exhibits robust profitability with a return on equity (ROE) of 9.35% and consistent gross margins over 40%, highlighting effective cost management and pricing strategies.
| Year | 2025 | 2024 | 2023 |
|---|---|---|---|
| Return on Equity | 8.40% | 15.43% | 15.60% |
| Return on Assets | 3.51% | 5.64% | 5.85% |
| Return on Invested Capital | 5.87% | 9.09% | 8.33% |
| Net Margin | 17.70% | 21.11% | 20.73% |
| EBIT Margin | 28.01% | 31.97% | 31.98% |
| EBITDA Margin | 34.17% | 36.68% | 36.89% |
| Gross Margin | 87.68% | 48.86% | 47.92% |
| R&D to Revenue | 0% | 0% | 0% |
The consistent performance across margins and returns signify a company well-positioned for profitability and efficient utilization of capital.
🌟 Price Development
🏅 Dividend Scoring System
| Category | Score | Bar |
|---|---|---|
| Dividend Yield | 3 | |
| Dividend Stability | 5 | |
| Dividend Growth | 4 | |
| Payout Ratio | 4 | |
| Financial Stability | 4 | |
| Dividend Continuity | 5 | |
| Cashflow Coverage | 5 | |
| Balance Sheet Quality | 4 |
Total Score: 34/40
📊 Rating
In conclusion, Brown & Brown, Inc. presents a stable, long-term dividend investment with its consistent payment history and moderate growth. The company's careful management of both payouts and reinvestment underscores its commitment to shareholder returns while maintaining a strong financial foundation. Recommended for income-focused investors seeking reliability and gradual growth in dividends. Overall, a commendable choice for conservative dividend portfolios.
Smart Data Insight
Master the Perfect Entry & Exit for this Stock
Don't leave your profits to chance. Historically, this stock follows specific seasonal patterns that institutional traders use to maximize returns.
- ✅ Identify the "Golden Buying Window"
- ✅ Avoid high-risk correction cycles
- ✅ Backtested data from the last 20+ years