January 20, 2026 a 07:31 am

BRO: Dividend Analysis - Brown & Brown, Inc.
Brown & Brown, Inc., a prominent player in the financial sector, boasts a solid dividend record with a consistent dividend distribution history spanning over 39 years. The company offers a modest dividend yield of 0.79% with a growing dividend per share. Given the company’s financial stability and moderate payout ratios, Brown & Brown stands out as a reliable dividend-paying entity in its sector.
📊 Overview
Brown & Brown, Inc., operating in the financial sector, exhibits a commendable dividend profile. The company’s retention of consistent dividend payouts over 39 years showcases its resilience and commitment to shareholders.
| Sector | Dividend yield (%) | Current dividend per share (USD) | Dividend history (years) | Last cut or suspension |
|---|---|---|---|---|
| Financial | 0.79 | 0.55 | 39 | 1991 |
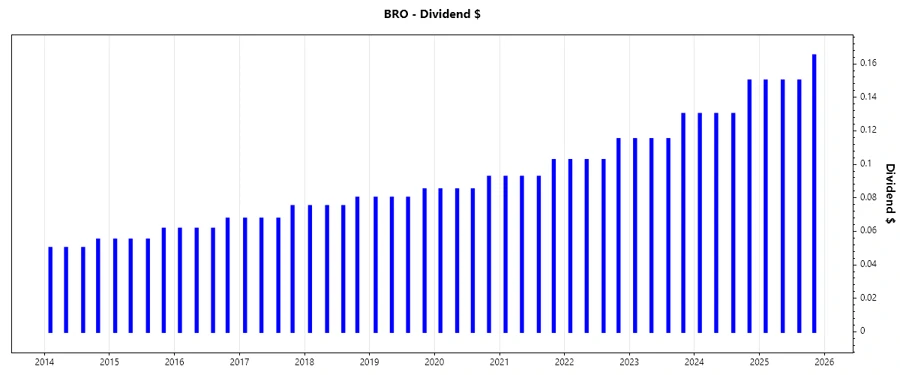
🗣️ Dividend History
Brown & Brown has a longstanding track record of dividend payments, a testament to its financial health and shareholder commitment. The progressive dividend history reflects its growing income potential and business expansion over the years.
| Year | Dividend per share (USD) |
|---|---|
| 2025 | 0.615 |
| 2024 | 0.540 |
| 2023 | 0.475 |
| 2022 | 0.4225 |
| 2021 | 0.3800 |
📈 Dividend Growth
Consistent dividend growth reflects the company’s commitment to enhancing shareholder value. The strategic management and business growth ensure a steady increment in dividends.
| Time | Growth (%) |
|---|---|
| 3 years | 13.33 % |
| 5 years | 12.09 % |
The average dividend growth is 12.09 % over 5 years. This shows moderate but steady dividend growth.
✅ Payout Ratio
The payout ratio is a critical indicator of the company's ability to sustain current dividend levels. Brown & Brown demonstrates sound financial management with low payout ratios, maintaining dividend sustainability and facilitating reinvestment in growth initiatives.
| Key figure | Ratio |
|---|---|
| EPS-based | 18.09 % |
| Free cash flow-based | 13.84 % |
With EPS-based payout at 18.09 % and FCF-based payout at 13.84 %, the company manifests adequate resource allocation for growth while rewarding shareholders.
🔄 Cashflow & Capital Efficiency
Efficient capital allocation ensures robust cash flow and supports operational efficiency. Brown & Brown's capital efficiency ratios underline a careful balance between operational demands and growth financing.
| Year | Free Cash Flow Yield | Earnings Yield | CAPEX to Operating Cash Flow | Stock-based Compensation to Revenue | Free Cash Flow / Operating Cash Flow Ratio |
|---|---|---|---|---|---|
| 2024 | 3.80% | 3.45% | 0.07 | 2.15% | 93 % |
| 2023 | 4.71% | 4.36% | 0.07 | 2.12% | 93.2 % |
| 2022 | 5.23% | 4.24% | 0.06 | 1.85% | 94 % |
The consistency in cash flow and capital efficiency metrics denotes proficient management and a capability towards sustaining operational growth.
🏦 Balance Sheet & Leverage Analysis
A strong balance sheet permits operational resilience, organizational growth, and financial flexibility under varying market conditions. Brown & Brown’s leverage metrics illustrate a prudent use of debt.
| Year | Debt-to-Equity | Debt-to-Assets | Debt-to-Capital | Current Ratio | Quick Ratio | Financial Leverage |
|---|---|---|---|---|---|---|
| 2024 | 0.63 | 0.23 | 0.39 | 1.18 | 1.10 | 2.74 |
| 2023 | 0.72 | 0.27 | 0.42 | 1.04 | 1.04 | 2.67 |
| 2022 | 0.91 | 0.30 | 0.48 | 1.09 | 1.09 | 3.03 |
Despite higher leverage, maintaining efficient risk management reflects the company’s strength in handling obligations and sustaining growth.
📉 Fundamental Strength & Profitability
Profitability metrics and margins highlight the fundamental strength of the organization. Brown & Brown’s strategic operational efficiency supports its competitive edge.
| Year | Return on Equity | Return on Assets | Net Margin | EBIT Margin | EBITDA Margin | Gross Margin | R&D to Revenue |
|---|---|---|---|---|---|---|---|
| 2024 | 15.43% | 5.64% | 21.11% | 31.96% | 36.68% | 48.86% | 0% |
| 2023 | 15.60% | 5.85% | 20.73% | 31.98% | 36.89% | 47.92% | 0% |
| 2022 | 14.58% | 4.81% | 18.85% | 28.74% | 33.96% | 49.00% | 0% |
Returns on equity and assets suggest robust profitability and efficient resource usage, promoting long-term shareholder value.
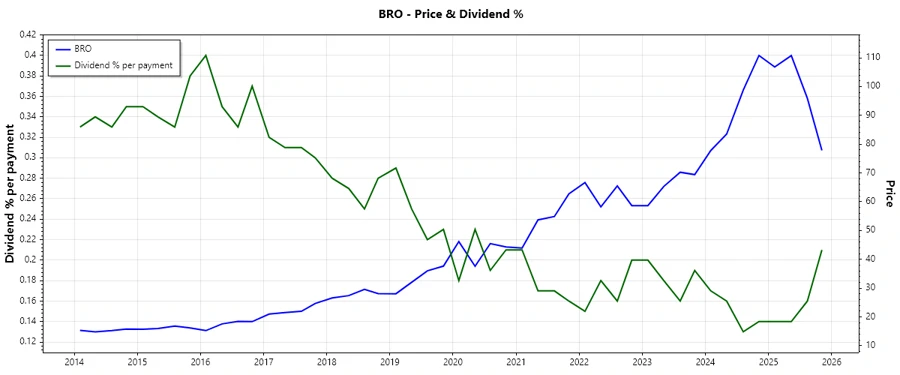
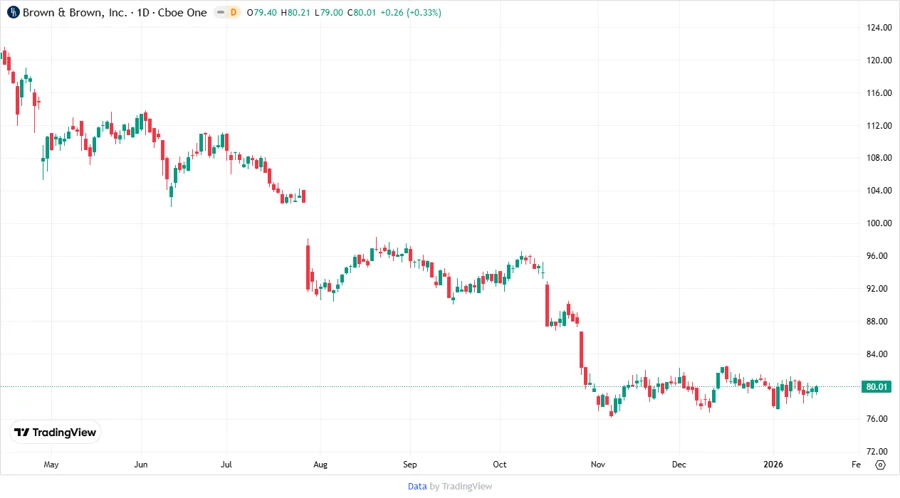
📊 Price Development
🗳️ Dividend Scoring System
Evaluating Brown & Brown’s dividend performance through several crucial measures provides clarity on its investment viability.
| Criteria | Score (out of 5) | Score Bar |
|---|---|---|
| Dividend yield | 2 | |
| Dividend Stability | 5 | |
| Dividend growth | 3 | |
| Payout ratio | 4 | |
| Financial stability | 4 | |
| Dividend continuity | 5 | |
| Cashflow Coverage | 4 | |
| Balance Sheet Quality | 4 |
Total score: 31/40
📉 Rating
With a commendable dividend history and robust financial performance, Brown & Brown, Inc. remains an attractive proposition for dividend-focused investors, offering stability and moderate growth prospects.