August 30, 2025 a 02:47 am


BRO: Dividend Analysis - Brown & Brown, Inc.
Brown & Brown, Inc. demonstrates a robust dividend profile characterized by a long history of steady payouts, potential for growth, and solid financial fundamentals. The company's strong balance sheet and prudent payout ratios indicate the sustainability of its dividends, catering to income-minded investors.
Overview 📊
Brown & Brown, Inc., operating within the insurance sector, presents a compelling case for dividend-focused investors. The firm maintains a modest yet stable dividend yield of 0.63%, complemented by an incremental growth trajectory over the past several years. This performance is underpinned by its 39-year-long dividend history and the absence of any recent cuts or suspensions.
| Metric | Value |
|---|---|
| Sector | Insurance |
| Dividend yield | 0.63 % |
| Current dividend per share | 0.55 USD |
| Dividend history | 39 years |
| Last cut or suspension | None |
Dividend History 🗣️
The historical dividend data of Brown & Brown, Inc. highlights its consistency and commitment to returning value to its shareholders. This reliable dividend history indicates the company’s financial stability and is crucial for investors seeking dependable income streams.
| Year | Dividend Per Share (USD) |
|---|---|
| 2025 | 0.45 |
| 2024 | 0.54 |
| 2023 | 0.475 |
| 2022 | 0.4225 |
| 2021 | 0.38 |
Dividend Growth 📈
Dividend growth of Brown & Brown, Inc. reflects its ability to enhance shareholder returns consistently. Over the past 3 and 5 years, the growth has been evident, showcasing a pattern of progressive financial performance.
| Time | Growth |
|---|---|
| 3 years | 12.43 % |
| 5 years | 10.69 % |
The average dividend growth is 10.69 % over 5 years. This shows moderate but steady dividend growth, indicating an ongoing commitment to increasing shareholder value through dividends.
Payout Ratio ✅
The payout ratios provide insight into Brown & Brown, Inc.’s dividend sustainability. These ratios assess how comfortably the company can maintain or grow its dividends.
| Key figure | Ratio |
|---|---|
| EPS-based | 15.85 % |
| Free cash flow-based | 14.25 % |
The low EPS payout ratio (15.85%) and FCF payout ratio (14.25%) suggest that the dividends are well-covered, allowing room for potential increases while also providing ample reinvestment capital.
Cashflow & Capital Efficiency 💰
Analyzing cash flow and capital efficiency metrics highlights how effectively Brown & Brown, Inc. manages its operations and invests its capital.
| Metric | 2024 | 2023 | 2022 |
|---|---|---|---|
| Free Cash Flow Yield | 3.80% | 4.71% | 5.23% |
| Earnings Yield | 3.45% | 4.36% | 4.24% |
| CAPEX to Operating Cash Flow | 5.60% | 6.83% | 5.97% |
| Stock-based Compensation to Revenue | 2.15% | 2.13% | 1.86% |
| Free Cash Flow / Operating Cash Flow Ratio | 93.02% | 93.17% | 94.03% |
These metrics indicate a high level of operational efficiency and capital allocation, suggesting that the firm is effectively generating cash flow relative to its operational needs without over-reliance on external financing.
Balance Sheet & Leverage Analysis 🧾
Assessing Brown & Brown, Inc.'s leverage and liquidity metrics provides insights into its financial structure and risk profile.
| Metric | 2024 | 2023 | 2022 |
|---|---|---|---|
| Debt-to-Equity | 0.63 | 0.72 | 0.91 |
| Debt-to-Assets | 0.23 | 0.27 | 0.30 |
| Debt-to-Capital | 0.39 | 0.42 | 0.48 |
| Net Debt to EBITDA | 2.00 | 2.25 | 2.87 |
| Current Ratio | 2.75 | 1.03 | 1.09 |
| Quick Ratio | 1.10 | 1.03 | 1.09 |
| Financial Leverage | 2.74 | 2.67 | 3.03 |
Brown & Brown, Inc.'s leverage ratios are within manageable levels, highlighting a stable financial structure and effective asset management approach, poised to sustain operations and expansion.
Fundamental Strength & Profitability 📈
These metrics depict Brown & Brown, Inc.'s profitability and operational strength, underpinning its ability to generate returns and fund further growth.
| Metric | 2024 | 2023 | 2022 |
|---|---|---|---|
| Return on Equity | 15.43% | 15.60% | 14.58% |
| Return on Assets | 5.64% | 5.85% | 4.81% |
| Net Margin | 21.11% | 20.73% | 18.85% |
| EBIT Margin | 31.18% | 30.22% | 29.27% |
| EBITDA Margin | 35.90% | 35.12% | 34.49% |
| Gross Margin | 48.86% | 47.93% | 49.01% |
| Research & Development to Revenue | 0% | 0% | 0% |
The consistent ROE and margins signify a strong profitability and a sustainable financial foundation, benefiting from operational efficiencies across key business segments.
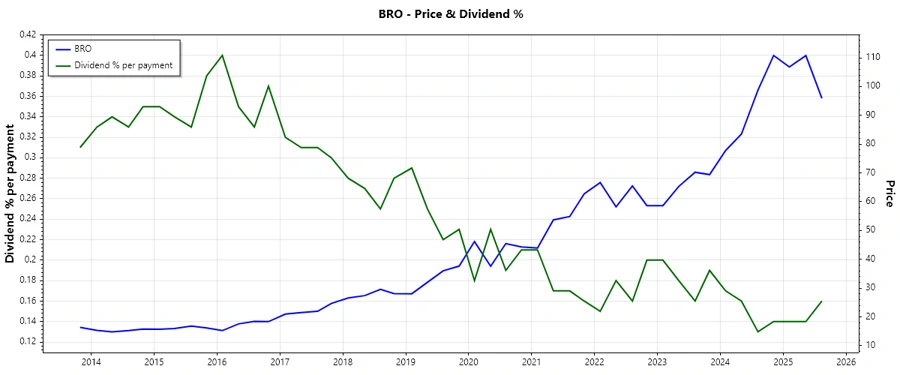
Price Development 📉
Dividend Scoring System ✅
Brown & Brown, Inc.’s dividend scoring offers a comprehensive assessment of its dividend capabilities and associated financial health.
| Category | Score | Bar |
|---|---|---|
| Dividend yield | 3 | |
| Dividend Stability | 5 | |
| Dividend growth | 4 | |
| Payout ratio | 5 | |
| Financial stability | 4 | |
| Dividend continuity | 5 | |
| Cashflow Coverage | 4 | |
| Balance Sheet Quality | 4 |
Total Score: 34 / 40
Rating ⭐
Brown & Brown, Inc. exemplifies a strong dividend play, appealing for investors seeking a reliable income stream backed by sound financial fundamentals. Its consistent dividend growth, prudent payout ratios, and solid balance sheet ensure sustainability. The company is well-positioned to continue providing value through dividends, making it a worthy addition to an income-focused portfolio.
Smart Data Insight
Master the Perfect Entry & Exit for this Stock
Don't leave your profits to chance. Historically, this stock follows specific seasonal patterns that institutional traders use to maximize returns.
- ✅ Identify the "Golden Buying Window"
- ✅ Avoid high-risk correction cycles
- ✅ Backtested data from the last 20+ years