
June 25, 2026 a 04:44 pm

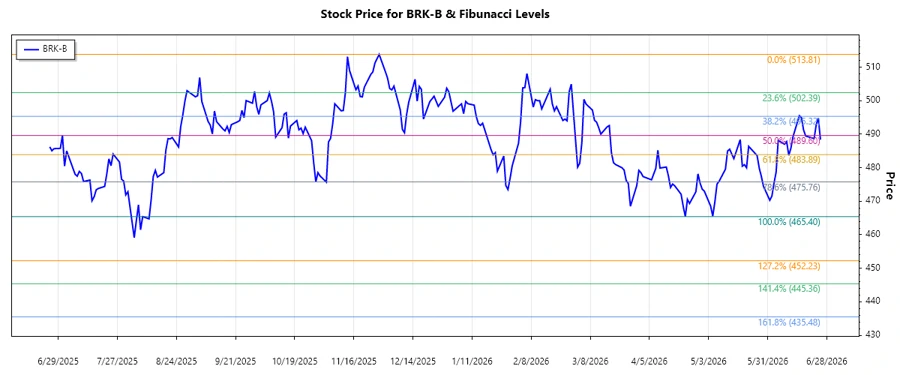
BRK-B: Fibonacci Analysis - Berkshire Hathaway Inc.
Berkshire Hathaway Inc. continues to be a dominant player in the global economy with its expansive conglomerate footprint. Despite a recent decline in its stock price, the overall trend from early 2025 continues to reflect resilience. Investors should note the stability and unique positioning of its core operations, making BRK-B a compelling long-term consideration. The technical analysis, however, shows potential retracement levels which need monitoring.
Fibonacci Analysis
| Attribute | Data | ||||||||||||
|---|---|---|---|---|---|---|---|---|---|---|---|---|---|
| Trend Start Date | 2025-11-28 | ||||||||||||
| Trend End Date | 2026-06-25 | ||||||||||||
| High Price (Date) | $513.81 (2025-11-28) | ||||||||||||
| Low Price (Date) | $465.40 (2025-08-07) | ||||||||||||
| Fibonacci Levels |
|
||||||||||||
| Current Price | $488.37 (2026-06-25) | ||||||||||||
| Retracement Zone | 0.236 | ||||||||||||
| Interpretation | The current price has reached the 0.236 retracement zone, indicating a potential support level. Investors may look for further confirmation before considering this a robust support point. |
Conclusion
Berkshire Hathaway's extensive economic involvement suggests strong resilience against market fluctuations. However, recent technical indicators highlight the importance of Fibonacci levels in understanding potential price retracement. Current stock levels inviting investors to monitor potential supports carefully. As a notable stock, any confirmed support at the 0.236 level could present buying opportunities. Still, analysts should remain prudent, considering market conditions and Berkshire's strategic positioning in various sectors. The risks involve possible further downside movement without strong support.
Smart Data Insight
Master the Perfect Entry & Exit for this Stock
Don't leave your profits to chance. Historically, this stock follows specific seasonal patterns that institutional traders use to maximize returns.
- ✅ Identify the "Golden Buying Window"
- ✅ Avoid high-risk correction cycles
- ✅ Backtested data from the last 20+ years