
July 03, 2026 a 03:15 am
BMY: Trend and Support & Resistance Analysis - Bristol-Myers Squibb Company
The stock of Bristol-Myers Squibb shows a varied historical price pattern. With its robust pharmaceutical portfolio, the company has immense market confidence. Examining recent price movements can illuminate potential market directions. Let's dive deeper into technical analysis for more informed investment decisions.
Trend Analysis
| Date | Closing Price (USD) | Trend |
|---|---|---|
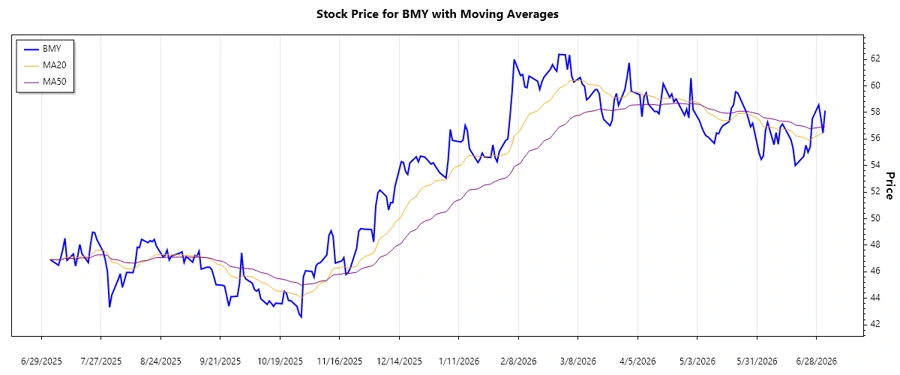
| 2026-07-02 | 58.13 | ▲ |
| 2026-07-01 | 56.44 | ▼ |
| 2026-06-30 | 57.62 | ▲ |
| 2026-06-29 | 58.56 | ▲ |
| 2026-06-26 | 57.52 | ▼ |
| 2026-06-25 | 55.39 | ▼ |
| 2026-06-24 | 55.00 | ▼ |
Calculated EMAs indicate a slight prevailing downtrend with some bullish bursts. Despite price fluctuations, maintaining a stable analysis of trend direction can yield profitable insights.
Support and Resistance
| Zone Type | From (USD) | To (USD) |
|---|---|---|
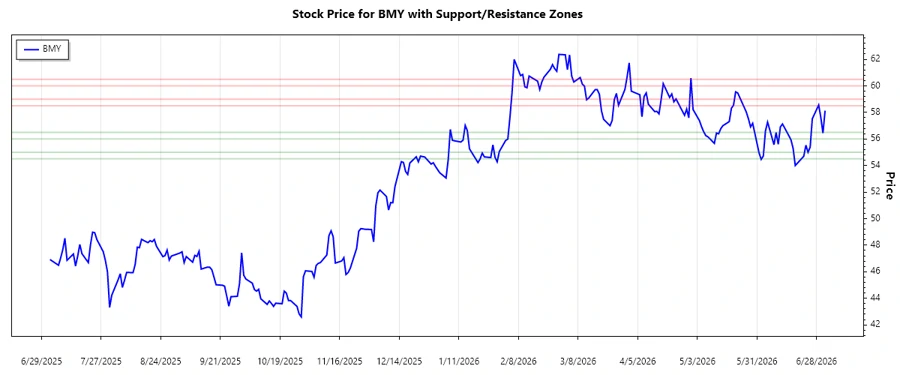
| Support | 54.5 | 55.0 |
| Support | 56.0 | 56.5 |
| Resistance | 58.5 | 59.0 |
| Resistance | 60.0 | 60.5 |
The current price is near a support zone, hovering around 58.0. Should this level hold, investors might see it as a potential buying opportunity, while resistance levels pose challenges.
Conclusion
The technical analysis of Bristol-Myers Squibb indicates moments of bearish potential, tempered by robust resistance levels unleashing bullish claws. Investors should remain cautious, employing stop-loss strategies to mitigate risks around pivotal support zones. In particular, EMA crossovers provide insightful trend biases, aiding data-driven decision-making. Yet, market fluctuations always accompany investment endeavors. json The above stock analysis provides a detailed assessment of Bristol-Myers Squibb company shares. The prevailing trend highlights a downward bias, yet with notable support and resistance levels that could influence future price action. Keep an eye on the data-driven insights for a balanced investment perspective.
Smart Data Insight
Master the Perfect Entry & Exit for this Stock
Don't leave your profits to chance. Historically, this stock follows specific seasonal patterns that institutional traders use to maximize returns.
- ✅ Identify the "Golden Buying Window"
- ✅ Avoid high-risk correction cycles
- ✅ Backtested data from the last 20+ years