March 13, 2026 a 04:03 am

BMY: Trend and Support & Resistance Analysis - Bristol-Myers Squibb Company
The Bristol-Myers Squibb Company, operating in the biopharmaceutical space, shows potential for growth due to its diverse product offerings in critical medical fields. The current stock trend dynamics suggest a capacity to capitalize on future market waves. However, the stock's recent movements indicate both opportunities and cautionary elements for investors. A technical analysis reveals critical insights into the company's market positioning.
Trend Analysis
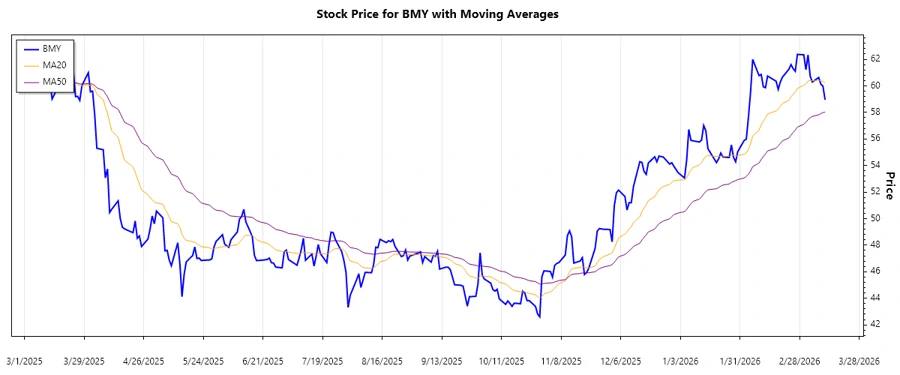
The trend analysis of Bristol-Myers Squibb Company over the recent months shows significant movements. The calculated EMAs indicate the following:
| Date | Close Price | Trend |
|---|---|---|
| 2026-03-12 | 58.95 | ▼ |
| 2026-03-11 | 59.98 | ▼ |
| 2026-03-10 | 60.13 | ▲ |
| 2026-03-09 | 60.63 | ▲ |
| 2026-03-06 | 60.29 | ▲ |
| 2026-03-05 | 60.74 | ▲ |
| 2026-03-04 | 62.33 | ▲ |
The EMA20 is greater than the EMA50 indicating an upward trend at the recent data points. This suggests potential stock appreciation.
Support and Resistance
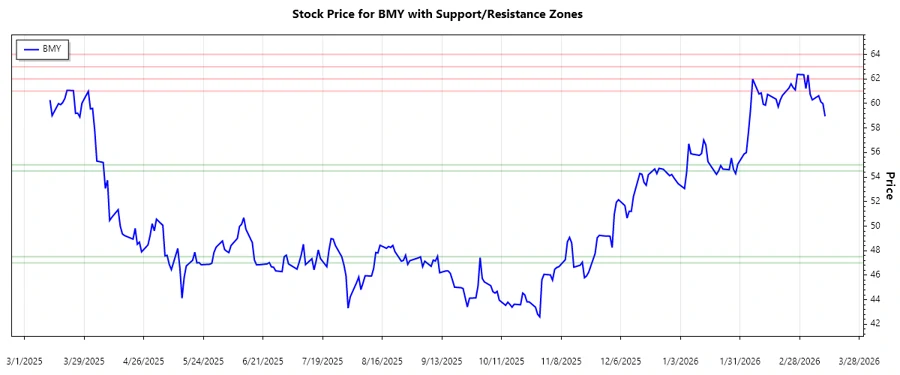
The technical analysis for support and resistance zones provides key insights:
| Zone Type | From | To |
|---|---|---|
| Support | 54.50 | 55.00 |
| Support | 47.00 | 47.50 |
| Resistance | 61.00 | 62.00 |
| Resistance | 63.00 | 64.00 |
The current price is nearing the resistance zone at 61.00, which could act as a barrier to further price increases. Technical evaluation suggests careful monitoring for potential breakout opportunities.
Conclusion
The recent analysis of the Bristol-Myers Squibb Company stock reveals it is in a promising phase, albeit with challenges. If it breaks the resistance, a higher valuation is likely, although investors should be cautious of sudden market downturns. Despite the robust EMA analysis, the price is approaching significant resistance zones which merit active observation. This combination of metrics presents both opportunities and risks, balanced by the company's established market presence.
JSON Output: