May 29, 2025 a 01:15 pm


BMY: Trend and Support & Resistance Analysis - Bristol-Myers Squibb Company
Bristol-Myers Squibb's (BMY) recent market performance showcases significant price fluctuations with evident declining trends over the past months. The stock price experienced a considerable decline in value, revealing vulnerabilities to market pressures. However, the company's solid foundation in the biopharmaceutical sector provides potential for future recovery. Monitoring technical indicators can provide insights into potential trend reversals.
Trend Analysis
Based on the calculated EMA20 and EMA50 values derived from the stock's closing prices, a clear downtrend is established. The EMAs suggest sustained downward momentum as EMA20 continues to be lower than EMA50. This indicates bearish sentiment in the short to mid-term.
| Date | Closing Price (USD) | Trend |
|---|---|---|
| 2025-05-28 | 46.97 | ▼ |
| 2025-05-27 | 46.89 | ▼ |
| 2025-05-23 | 46.85 | ▼ |
| 2025-05-22 | 47.03 | ▼ |
| 2025-05-21 | 47.00 | ▼ |
| 2025-05-20 | 47.87 | ▼ |
| 2025-05-19 | 47.22 | ▼ |
The consistent bearish trend points to potential further declines unless a significant reversal or positive catalyst arises.
Support and Resistance
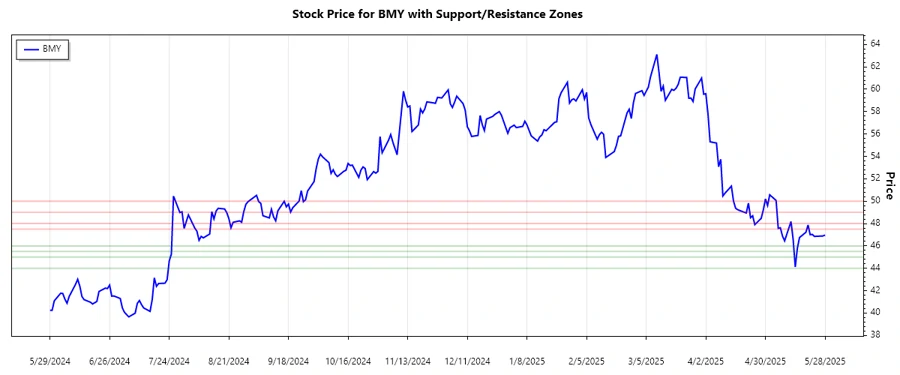
Analysis of BMY's closing prices identifies two major support and resistance zones. The stock currently resides within a resistance zone, challenging any upward movement and intensifying the bearish outlook.
| Zone Type | From (USD) | To (USD) |
|---|---|---|
| Resistance ▲ | 47.50 | 48.00 |
| Resistance ▲ | 49.00 | 50.00 |
| Support ▼ | 45.50 | 46.00 |
| Support ▼ | 44.00 | 45.00 |
BMY is currently facing resistance at the upper levels, which might limit any immediate positive gain. It needs to surpass its resistance levels to signal a potential reversal.
Conclusion
The ongoing downward trend in Bristol-Myers Squibb's stock price indicates persistent bearish sentiment in the market. Although the company operates in a critical sector with strong potential for innovation, current price movements suggest caution. Investors should consider the support and resistance levels identified, which provide a framework for potential strategy adjustments. The strengths of the company's product lineup may offer a hedge against long-term declines, but technical indicators call for careful market monitoring.
Smart Data Insight
Master the Perfect Entry & Exit for this Stock
Don't leave your profits to chance. Historically, this stock follows specific seasonal patterns that institutional traders use to maximize returns.
- ✅ Identify the "Golden Buying Window"
- ✅ Avoid high-risk correction cycles
- ✅ Backtested data from the last 20+ years