May 06, 2026 a 06:44 am
BMY: Fibonacci Analysis - Bristol-Myers Squibb Company
Bristol-Myers Squibb Company has shown a significant upward trend over the past months. This biopharmaceutical giant continues to deliver on its impressive product lineup, spanning hematology, oncology, and more. Investor interest remains strong, supported by innovations and strategic market presence. Technical analysis indicates potential continued growth, with strategic Fibonacci levels providing insights into future price movements.
Fibonacci Analysis
| Details | Figures |
|---|---|
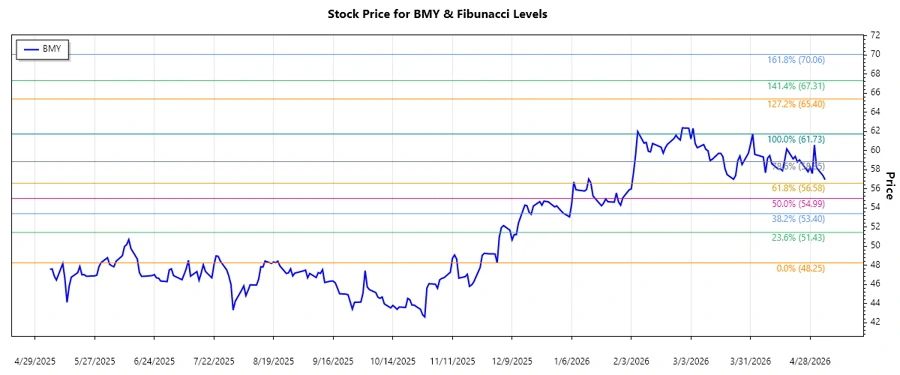
| Trend Period | 2025-12-02 to 2026-04-30 |
| High Point | $61.73 on 2026-04-01 |
| Low Point | $48.25 on 2025-12-02 |
| Fibonacci Level | Price Level |
|---|---|
| 0.236 | 55.32 |
| 0.382 | 53.88 |
| 0.5 | 52.99 |
| 0.618 | 52.10 |
| 0.786 | 50.76 |
The recent price is in the 0.236 retracement zone, indicating potential support at this level. If the stock holds above this, it may suggest a continuation of the upward trend, but a move below could lead to further retracement.
Conclusion
Bristol-Myers Squibb Company exhibits a strong bullish pattern, supported by substantial advancements in its key markets. The upward trend identified reflects investor confidence in its products and strategies. However, risks persist as market fluctuations and competitive pressures remain. For technical analysts, the stock's position within the Fibonacci retracement levels suggests a strategic point, balancing between future gains and corrections. Close monitoring of these levels is advisable to gauge potential shifts in momentum.
Smart Data Insight
Master the Perfect Entry & Exit for this Stock
Don't leave your profits to chance. Historically, this stock follows specific seasonal patterns that institutional traders use to maximize returns.
- ✅ Identify the "Golden Buying Window"
- ✅ Avoid high-risk correction cycles
- ✅ Backtested data from the last 20+ years