June 09, 2026 a 03:31 am


BMY: Dividend Analysis - Bristol-Myers Squibb Company
The Bristol-Myers Squibb Company stands as a formidable player in the healthcare sector, maintaining a solid track record in its dividend history. With a substantial dividend yield, it remains an attractive option for income-focused investors. The company's payout practices, bolstered by a strong earnings base, demonstrate a balanced approach to capital allocation.
📊 Overview
Bristol-Myers Squibb operates in the highly competitive healthcare sector. The firm has consistently provided dividends to its shareholders, underlining its commitment to returning capital. The figures below present a snapshot of its current dividend profile:
| Metric | Value |
|---|---|
| Sector | Healthcare |
| Dividend yield | 4.19% |
| Current dividend per share | $2.47 |
| Dividend history | 55 years |
| Last cut or suspension | None |
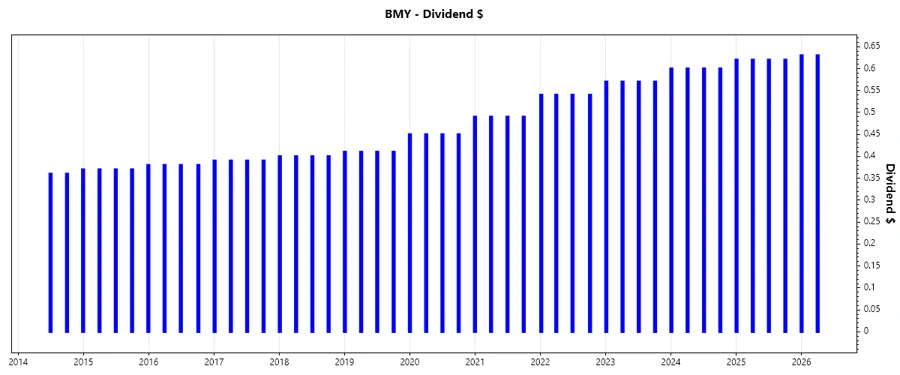
📈 Dividend History
The historical dividend practices of Bristol-Myers Squibb illustrate its long-term strategy and commitment to rewarding its shareholders. These dividends serve as a sign of financial health and operational strength.
| Year | Dividend Per Share (USD) |
|---|---|
| 2026 | 1.26 |
| 2025 | 2.48 |
| 2024 | 2.40 |
| 2023 | 2.28 |
| 2022 | 2.16 |
📉 Dividend Growth
Tracking the growth of dividends over the years gives insights into potential future increases, aligning with the company's growth and profitability aspirations.
| Time | Growth |
|---|---|
| 3 years | 4.71% |
| 5 years | 1.61% |
The average dividend growth is 1.61% over 5 years. This shows moderate but steady dividend growth.
✅ Payout Ratio
The payout ratio demonstrates the company's capacity to sustain dividend payments from earnings and cash flow, providing insights into its fiscal discipline.
| Payout Ratio Type | Percentage |
|---|---|
| EPS-based | 69.43% |
| Free cash flow-based | 42.39% |
An EPS payout ratio of 69.43% suggests a balanced approach, targeting sustainable payouts, whereas the free cash flow payout of 42.39% demonstrates strong cash flow support for dividends.
💰 Cashflow & Capital Efficiency
An analysis of cash flow metrics provides insights into how capital is generated and reinvested within the company, critical for long-term evaluations.
| Metric | 2023 | 2024 | 2025 |
|---|---|---|---|
| Free Cash Flow Yield | 11.92% | 12.16% | 11.67% |
| Earnings Yield | 7.56% | -7.80% | 6.40% |
| CAPEX to Operating Cash Flow | 8.72% | 8.22% | 9.26% |
| Stock-based Compensation to Revenue | 1.15% | 1.05% | 1.15% |
| Free Cash Flow / Operating Cash Flow Ratio | 91.28% | 91.78% | 90.74% |
The healthy free cash flow yield coupled with sound operating cash flow ratios underscores the company's efficient financial management, with capital deployed effectively towards sustainable growth.
🏦 Balance Sheet & Leverage Analysis
Analyzing BMY's balance sheet and leverage ratios reveals its ability to manage debt and maintain liquidity and solvency, which are crucial for assessing financial robustness.
| Metric | 2023 | 2024 | 2025 |
|---|---|---|---|
| Debt-to-Equity | 1.41 | 3.13 | 2.55 |
| Debt-to-Assets | 43.57% | 55.29% | 52.35% |
| Debt-to-Capital | 58.49% | 75.81% | 71.85% |
| Net Debt to EBITDA | 1.55 | 12.90 | 2.54 |
| Current Ratio | 1.43 | 0 | 1.25 |
| Quick Ratio | 1.31 | 1.15 | 1.14 |
| Financial Leverage | 3.23 | 5.67 | 4.87 |
The leverage ratios illustrate a robust balance sheet with effective management of financial obligations. Despite the significant liquidity during 2023, consistent leverage levels suggest strategic debt decisions.
📈 Fundamental Strength & Profitability
The fundamental strength of BMY, indicated by profitability ratios, sheds light on its operational efficiency and ability to convert revenue into profits.
| Metric | 2023 | 2024 | 2025 |
|---|---|---|---|
| Return on Equity | 27.27% | -54.78% | 38.18% |
| Return on Assets | 8.43% | -9.66% | 7.83% |
| Net Margin | 17.83% | -18.53% | 14.63% |
| EBIT Margin | 21.34% | -13.32% | 22.17% |
| EBITDA Margin | 43.03% | 6.56% | 30.18% |
| Gross Margin | 56.34% | 56.79% | 67.65% |
| R&D to Revenue | 20.46% | 20.25% | 20.67% |
BMY's profitability ratios highlight its competent operations amidst varying market conditions, with a strategic emphasis on innovative research and efficient operations facilitating sustainable returns.
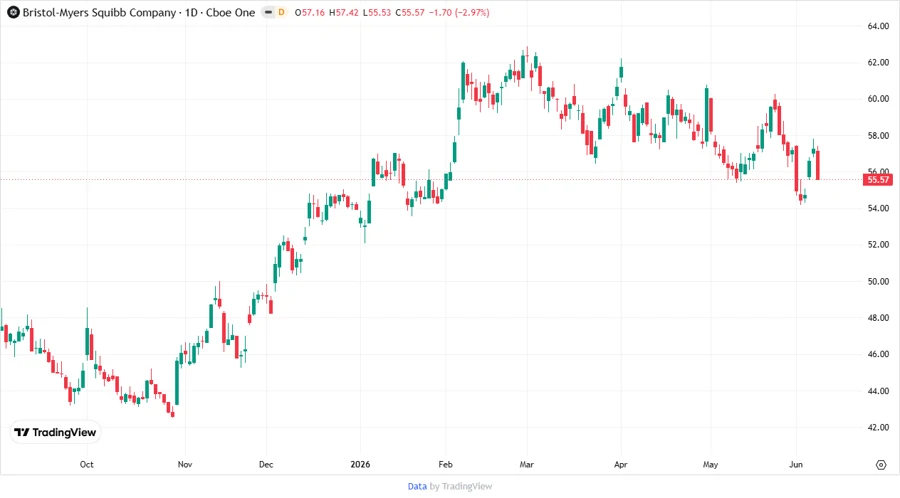
💹 Price Development
📏 Dividend Scoring System
| Criterion | Score | |
|---|---|---|
| Dividend yield | 4 | |
| Dividend Stability | 5 | |
| Dividend growth | 3 | |
| Payout ratio | 3 | |
| Financial stability | 4 | |
| Dividend continuity | 5 | |
| Cashflow Coverage | 4 | |
| Balance Sheet Quality | 4 |
Total Score: 32/40
🗣️ Rating
In conclusion, Bristol-Myers Squibb exhibits a strong commitment to shareholder returns, demonstrated by its reliable dividend payments and financial prudence. Despite certain challenges, the company maintains a robust balance sheet, effective cash flow management, and consistent dividend policies, making it an attractive choice for investors seeking stability and gradual growth in their portfolios.
Smart Data Insight
Master the Perfect Entry & Exit for this Stock
Don't leave your profits to chance. Historically, this stock follows specific seasonal patterns that institutional traders use to maximize returns.
- ✅ Identify the "Golden Buying Window"
- ✅ Avoid high-risk correction cycles
- ✅ Backtested data from the last 20+ years