March 24, 2026 a 12:46 pm


BMY: Dividend Analysis - Bristol-Myers Squibb Company
Bristol-Myers Squibb Company, with its strong dividend yield of 4.39% and a lengthy dividend history spanning 55 years, presents a compelling case for income-focused investors. The company's moderate dividend growth over the years reflects its commitment to returning value to shareholders. However, the notable EPS-based payout ratio of 71.53% may warrant closer scrutiny regarding potential sustainability.
📊 Overview
Bristol-Myers Squibb operates in the healthcare sector, demonstrating a solid dividend profile with key metrics indicating strength and stability.
| Attribute | Value |
|---|---|
| Sector | Healthcare |
| Dividend yield | 4.39 % |
| Current dividend per share | 2.47 USD |
| Dividend history | 55 years |
| Last cut or suspension | None |
📈 Dividend History
An extensive dividend history signals consistent returns to shareholders, enhancing investor confidence in dividend sustainability.
| Year | Dividend per share (USD) |
|---|---|
| 2026 | 1.26 |
| 2025 | 2.48 |
| 2024 | 2.4 |
| 2023 | 2.28 |
| 2022 | 2.16 |
📈 Dividend Growth
Understanding dividend growth rates helps gauge the company's commitment to increasing shareholder payouts over time.
| Time | Growth |
|---|---|
| 3 years | 4.71 % |
| 5 years | 1.61 % |
The average dividend growth is 1.61 % over 5 years. This shows moderate but steady dividend growth.
✅ Payout Ratio
The payout ratio analysis reveals the proportion of earnings and cash flow distributed to shareholders as dividends, offering insights into sustainability.
| Key figure ratio | Value |
|---|---|
| EPS-based | 71.53 % |
| Free cash flow-based | 39.19 % |
This indicates a high but manageable EPS-based payout ratio, suggesting risk if earnings decline, whereas the free cash flow-based ratio shows healthier coverage.
Cashflow & Capital Efficiency
Cashflow efficiency ratios illustrate how effectively the company generates and utilizes cash, key to understanding its financial health.
| Metric | 2025 | 2024 | 2023 |
|---|---|---|---|
| Free Cash Flow Yield | 11.67 % | 12.16 % | 11.92 % |
| Earnings Yield | 6.41 % | -7.80 % | 7.56 % |
| CAPEX to Operating Cash Flow | 9.26 % | 8.22 % | 8.72 % |
| Stock-based Compensation to Revenue | 1.15 % | 1.05 % | 1.15 % |
| Free Cash Flow / Operating Cash Flow Ratio | 90.74 % | 91.78 % | 91.28 % |
| Return on Invested Capital | 13.90 % | 13.59 % | 10.59 % |
The data reflects strong cash generation and efficient asset utilization, particularly highlighted by the high Free Cash Flow Yield and ROIC.
Balance Sheet & Leverage Analysis
Assessing balance sheet ratios offers insights into the company's ability to manage debt and financial obligations.
| Metric | 2025 | 2024 | 2023 |
|---|---|---|---|
| Debt-to-Equity | 2.55 | 3.13 | 1.41 |
| Debt-to-Assets | 52.35 % | 55.29 % | 43.57 % |
| Debt-to-Capital | 71.85 % | 75.81 % | 58.49 % |
| Net Debt to EBITDA | 2.54 | 12.90 | 1.55 |
| Current Ratio | 1.26 | 1.25 | 1.43 |
| Quick Ratio | 1.14 | 1.15 | 1.31 |
| Financial Leverage | 4.87 | 5.67 | 3.23 |
While the company exhibits high leverage, its solid interest coverage and current ratios mitigate immediate default risks.
Fundamental Strength & Profitability
Profitability ratios reflect the efficiency and effectiveness with which a company converts revenue into profit.
| Metric | 2025 | 2024 | 2023 |
|---|---|---|---|
| Return on Equity | 38.18 % | -54.78 % | 27.27 % |
| Return on Assets | 7.83 % | -9.66 % | 8.43 % |
| Margins: Net | 14.63 % | -18.53 % | 17.83 % |
| Margins: EBIT | 22.17 % | -13.32 % | 21.34 % |
| Margins: EBITDA | 30.18 % | 6.56 % | 43.03 % |
| Margins: Gross | 67.65 % | 56.79 % | 56.34 % |
| R&D to Revenue | 19.94 % | 20.25 % | 20.46 % |
Strong revenue generation capabilities, particularly through R&D investment, contribute to the company's profitability despite volatility in margins.
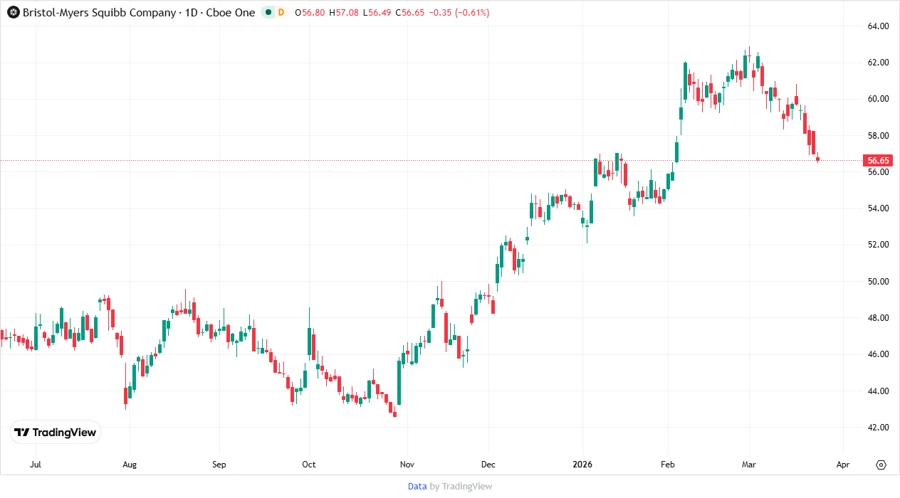
Price Development
Dividend Scoring System
| Criteria | Description | Score |
|---|---|---|
| Dividend yield | Assess the attractiveness of yield. | |
| Dividend Stability | Evaluate historical consistency. | |
| Dividend growth | Measure upward trends. | |
| Payout ratio | Analyze for sustainability. | |
| Financial stability | Overall financial health. | |
| Dividend continuity | Continuation without cuts. | |
| Cashflow Coverage | Dividends covered by cashflow. | |
| Balance Sheet Quality | Health of the balance sheet. |
Total Score: 52/80
Rating
Bristol-Myers Squibb Company maintains a strong dividend profile characterized by its robust yield and long-standing history. Its high payout ratio warrants caution, although managed leveraging and effective cashflow strategies support its dividend commitments. Investors seeking steady income may find this stock appealing, conditioned on the financial flexibility reflected in ongoing earnings and cash flow stability.
Smart Data Insight
Master the Perfect Entry & Exit for this Stock
Don't leave your profits to chance. Historically, this stock follows specific seasonal patterns that institutional traders use to maximize returns.
- ✅ Identify the "Golden Buying Window"
- ✅ Avoid high-risk correction cycles
- ✅ Backtested data from the last 20+ years