December 17, 2025 a 12:47 pm


BMY: Dividend Analysis - Bristol-Myers Squibb Company
The dividend profile of Bristol-Myers Squibb Company reveals a promising outlook with a dividend yield of 4.59% and a long history of dividend payments spanning 55 years. Despite recent challenges, the company's commitment to maintaining robust dividends reflects its stability in the pharmaceutical sector. A cautious eye on payout ratios and growth metrics is essential for potential investors.
📊 Overview
Bristol-Myers Squibb operates within the pharmaceutical sector, a field known for consistent dividend payouts and lucrative growth opportunities. The current dividend yield of 4.59% is competitive, coupled with a current dividend per share of $2.40. Historically resilient, the dividend history spans 55 years, though the last recorded cut occurred in 2026.
| Metric | Details |
|---|---|
| Sector | Pharmaceuticals |
| Dividend yield | 4.59% |
| Current dividend per share | 2.40 USD |
| Dividend history | 55 years |
| Last cut or suspension | 2026 |
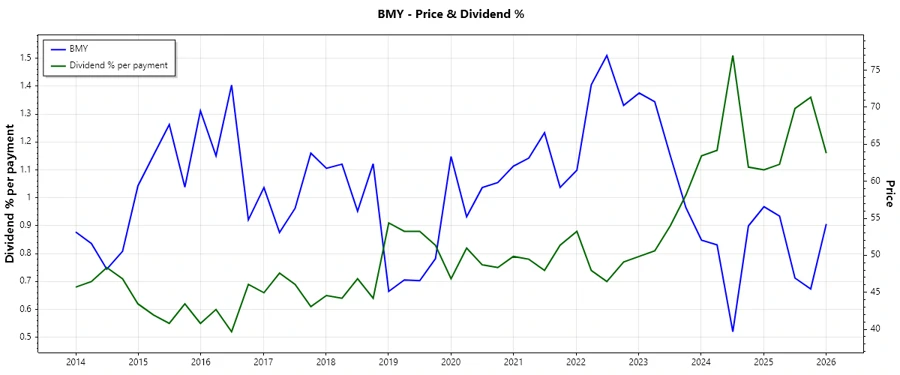
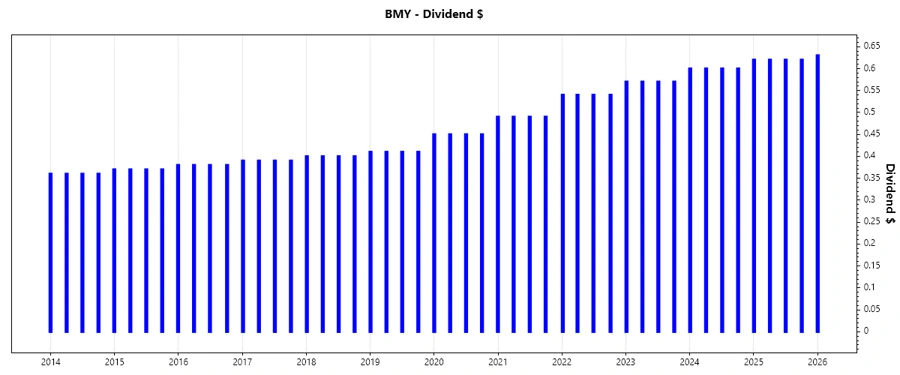
📈 Dividend History
Bristol-Myers Squibb's dividend history underscores its financial resilience and dedication to shareholder returns. Consistently increasing dividends over the years is a positive indicator of the company’s robust financial health.
| Year | Dividend Per Share (USD) |
|---|---|
| 2026 | 0.63 |
| 2025 | 2.48 |
| 2024 | 2.40 |
| 2023 | 2.28 |
| 2022 | 2.16 |
📊 Dividend Growth
The dividend growth rate provides investors a measure of income growth over time. Evaluating the 3-year growth at 0.18% against a 5-year average growth rate of 0.08% offers insights into the company's dividend policy and long-term financial strategy.
| Time | Growth |
|---|---|
| 3 years | 0.18% |
| 5 years | 0.08% |
The average dividend growth is 0.08% over 5 years. This shows moderate but steady dividend growth.
📉 Payout Ratio
Payout ratios are critical for assessing sustainability. Bristol-Myers Squibb shows an EPS-based payout ratio of approximately 81% and an FCF-based ratio of 32%. While the EPS ratio could signify elevated payouts relative to earnings, the FCF ratio suggests better coverage through cash flow.
| Key Figure | Ratio |
|---|---|
| EPS-based | 81.00% |
| Free cash flow-based | 32.00% |
With an EPS payout of 81% and FCF payout of 32%, the dividends appear well-covered by cash flows, although caution is recommended given the EPS level.
💵 Cashflow & Capital Efficiency
Analyzing cash flow and capital efficiency can highlight underlying strengths or weaknesses in operational and capital allocation strategies. For Bristol-Myers Squibb, the free cash flow yield and earnings yield indicate respectable cash generation relative to the market valuation.
| 2024 | 2023 | 2022 | |
|---|---|---|---|
| Free cash flow yield | 12.16% | 11.92% | 7.80% |
| Earnings yield | -7.80% | 7.56% | 4.13% |
| CAPEX to Operating Cash Flow | 8.22% | 8.72% | 8.56% |
| Stock-based Compensation to Revenue | 1.12% | 1.15% | 0.99% |
| Free Cash Flow / Operating Cash Flow Ratio | 91.78% | 91.28% | 91.44% |
The stability of cash flow and capital efficiency metrics suggest that while earnings have been volatile, operational cash flow remains strong, supporting its dividend profile.
🧾 Balance Sheet & Leverage Analysis
The balance sheet and leverage ratios offer insight into the company's financial health and risk. For instance, a debt-to-equity ratio of over 3 indicates substantial leverage, potentially posing risks in adverse market conditions.
| 2024 | 2023 | 2022 | |
|---|---|---|---|
| Debt-to-Equity | 3.13 | 1.41 | 1.31 |
| Debt-to-Assets | 0.55 | 0.44 | 0.42 |
| Debt-to-Capital | 0.76 | 0.58 | 0.57 |
| Net Debt to EBITDA | 12.90 | 1.55 | 1.64 |
| Current Ratio | 0 | 1.43 | 1.25 |
| Quick Ratio | 1.15 | 1.31 | 1.14 |
| Financial Leverage | 5.67 | 3.23 | 3.12 |
Bristol-Myers Squibb demonstrates a strong ability to cover its obligations, though high leverage ratios necessitate vigilant financial management.
📊 Fundamental Strength & Profitability
Profitability metrics such as ROE and margins are integral to assessing the efficiency and potential growth of the company. Bristol-Myers Squibb shows diverse returns which reflect the business's complexity and strategic investments.
| 2024 | 2023 | 2022 | |
|---|---|---|---|
| Return on Equity | -54.78% | 27.27% | 20.37% |
| Return on Assets | -9.66% | 8.43% | 6.53% |
| Net Margin | -18.53% | 17.83% | 13.71% |
| EBIT Margin | -13.32% | 21.34% | 19.38% |
| EBITDA Margin | 6.56% | 43.03% | 41.64% |
| Gross Margin | 56.80% | 56.34% | 57.39% |
| R&D to Revenue | 20.25% | 20.46% | 20.39% |
The fundamental strength underscores a strong revenue base and strategic resource allocation via R&D, despite fluctuating return metrics.
Price Development
✅ Dividend Scoring System
| Criteria | Score | Rating |
|---|---|---|
| Dividend yield | 4 | |
| Dividend Stability | 5 | |
| Dividend growth | 3 | |
| Payout ratio | 3 | |
| Financial stability | 4 | |
| Dividend continuity | 5 | |
| Cashflow Coverage | 3 | |
| Balance Sheet Quality | 3 |
Total Score: 30/40
🗣️ Rating
Bristol-Myers Squibb maintains a commendable dividend profile. The overall score of 30 out of 40 points suggests a solid investment with robust dividend continuity and stability, though attention to payout ratios and growth metrics should be prioritized in forward-looking assessments.