November 28, 2025 a 03:31 pm

BMY: Dividend Analysis - Bristol-Myers Squibb Company
📊 Bristol-Myers Squibb Company (BMY) boasts a robust dividend history with a steady yield of 5.46%. The company's dedication to returning value to shareholders is evident through its consistent dividend growth over 54 years. Analyzing its payout ratio and financial health reveals moderate risk, making it a potential candidate for income-focused investors.
Overview
🗣️ Delving into Bristol-Myers Squibb's dividend profile, we note its steadfast sector presence and commitment to dividends. Key indicators include its 5.46% dividend yield and no recent suspensions, reinforcing its reliable dividend strategy.
| Sector | Dividend yield | Current dividend per share | Dividend history | Last cut or suspension |
|---|---|---|---|---|
| Pharmaceuticals | 5.46 % | 2.40 USD | 54 years | 2021 |
Dividend History
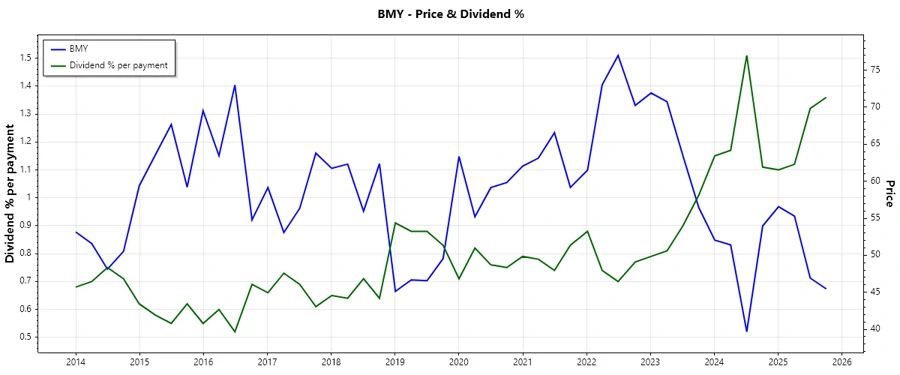
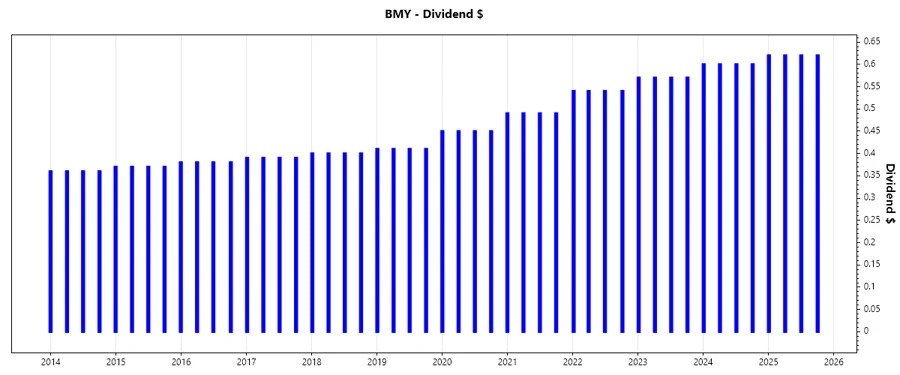
📉 Exploring historical dividend data highlights the company’s resilience. Sustained payouts indicate strategic stability and long-term value delivery to shareholders. Understanding past dividends is crucial for predicting future performance.
| Year | Dividend per Share (USD) |
|---|---|
| 2025 | 2.48 |
| 2024 | 2.40 |
| 2023 | 2.28 |
| 2022 | 2.16 |
| 2021 | 1.47 |
Dividend Growth
📈 A vivid portrayal of dividend growth confirms Bristol-Myers’ adept policy execution. Continuous growth over 3 and 5 years demonstrates shareholder value prioritization.
| Time | Growth |
|---|---|
| 3 years | 17.75 % |
| 5 years | 7.91 % |
The average dividend growth is 7.91 % over 5 years. This shows moderate but steady dividend growth.
Payout Ratio
⚠️ Scrutiny of payout ratios, based on EPS at 80.96% and FCF at 31.92%, indicates a well-managed dividend policy aligned with earnings and cash flow sustainability.
| Ratio | |
|---|---|
| EPS-based | 80.96 % |
| Free cash flow-based | 31.92 % |
The EPS payout ratio suggests high but manageable dividends, whereas the FCF ratio indicates robust cash flow coverage.
Cashflow & Capital Efficiency
✅ Analyzing cash flow and capital efficiency sheds light on operational resilience and capital utilization effectiveness, crucial for sustaining dividends.
| Metric | 2024 | 2023 | 2022 |
|---|---|---|---|
| Free Cash Flow Yield | 12.16% | 11.92% | 7.80% |
| Earnings Yield | -7.80% | 7.55% | 4.12% |
| CAPEX to Operating Cash Flow | 8.22% | 8.73% | 8.56% |
| Stock-based Compensation to Revenue | 1.14% | 1.15% | 0.99% |
| Free Cash Flow / Operating Cash Flow Ratio | 91.78% | 91.28% | 91.44% |
Consistent free cash flow and efficient capital allocation emphasize financial prudence aimed at ensuring reliable dividend payments.
Balance Sheet & Leverage Analysis
💡 Balance sheet and leverage metrics provide insights into financial stability and debt management, essential for long-term sustainability.
| Metric | 2024 | 2023 | 2022 |
|---|---|---|---|
| Debt-to-Equity | 3.13 | 1.41 | 1.31 |
| Debt-to-Assets | 55.29% | 43.57% | 42.05% |
| Debt-to-Capital | 75.81% | 58.49% | 56.73% |
| Net Debt to EBITDA | 12.90 | 1.55 | 1.64 |
| Current Ratio | 1.25 | 1.43 | 1.25 |
| Quick Ratio | 1.15 | 1.31 | 1.14 |
| Financial Leverage | 5.67 | 3.23 | 3.12 |
Strong balance sheet metrics reflect solid liquidity, but potential leverage risks must be monitored closely.
Fundamental Strength & Profitability
🔍 Assessing fundamentals and profitability reveals core strengths and operational efficiency pivotal for sustaining dividends.
| Metric | 2024 | 2023 | 2022 |
|---|---|---|---|
| Return on Equity | -54.78% | 27.27% | 20.37% |
| Return on Assets | -9.66% | 8.43% | 6.53% |
| Return on Invested Capital | 14.49% | 10.59% | 9.61% |
| Net Margin | -18.53% | 17.83% | 13.71% |
| EBIT Margin | -13.32% | 21.34% | 19.38% |
| EBITDA Margin | 6.56% | 43.03% | 41.64% |
| Gross Margin | 56.8% | 56.3% | 57.4% |
| R&D to Revenue | 20.25% | 20.46% | 20.39% |
Profitability metrics underscore operational efficiency, but negative returns in 2024 warrant cautious analysis.
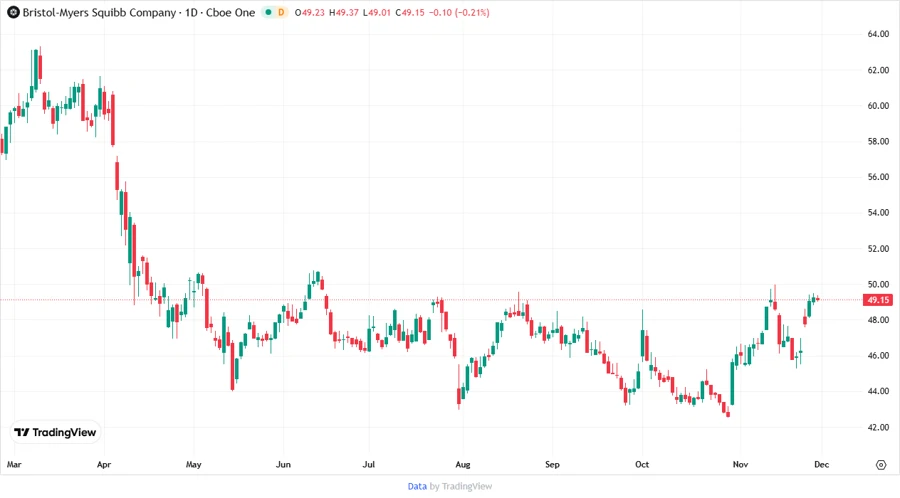
Price Development
Dividend Scoring System
| Category | Score | |
|---|---|---|
| Dividend yield | 4 | |
| Dividend Stability | 4 | |
| Dividend growth | 3 | |
| Payout ratio | 3 | |
| Financial stability | 3 | |
| Dividend continuity | 5 | |
| Cashflow Coverage | 4 | |
| Balance Sheet Quality | 3 |
Total Score: 29/40
Rating
🔔 Given the comprehensive analysis of the dividend profile, Bristol-Myers Squibb presents itself as a stable dividend-paying entity with moderate growth opportunities. Its financial strategy remains solid, warranting an investment consideration for dividend-focused portfolios. However, continued monitoring of payout ratios and returns is recommended.