October 23, 2025 a 12:47 pm


BMY: Dividend Analysis - Bristol-Myers Squibb Company
Bristol-Myers Squibb Company demonstrates a strong dividend yield alongside a long history of dividend payments. With recent fluctuations in dividend stability, it's crucial for investors to weigh the potential rewards against market uncertainties. The current dividend metrics suggest stability but remain under careful observation due to historical cuts.
📊 Overview
Bristol-Myers Squibb is a leader within its sector, providing investors with a robust dividend package. The company's commitment to dividend payments is supported by a high yield and a significant history of distributions, despite recent challenges.
| Key Metric | Detail |
|---|---|
| Sector | Pharmaceuticals |
| Dividend yield | 5.46 % |
| Current dividend per share | 2.40 USD |
| Dividend history | 54 years |
| Last cut or suspension | 2021 |
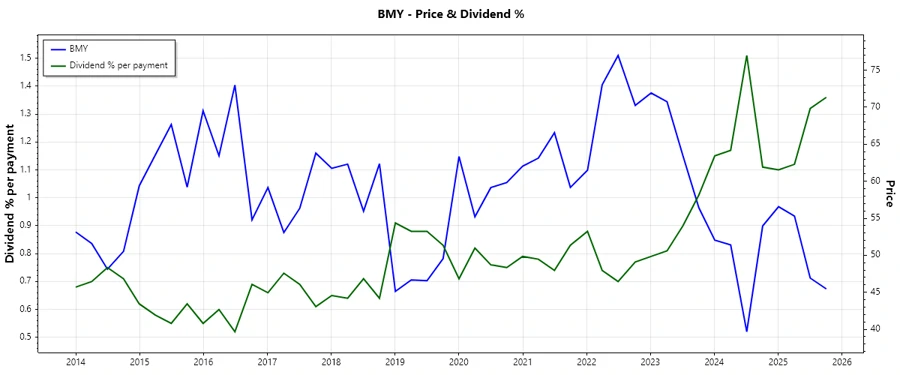
📈 Dividend History
Reflective of its robust fiscal strategy, Bristol-Myers Squibb’s extensive dividend history underscores its reliability as a dividend payer. This consistency is appealing to income-focused investors.
| Year | Dividend Per Share (USD) |
|---|---|
| 2025 | 2.48 |
| 2024 | 2.40 |
| 2023 | 2.28 |
| 2022 | 2.16 |
| 2021 | 1.47 |
📈 Dividend Growth
Analyzing the growth presents a comprehensive view of a company's ability to increase dividends consistently. The observed growth rates provide insight into the headway made by Bristol-Myers Squibb in enhancing shareholder returns.
| Time | Growth |
|---|---|
| 3 years | 0.18 % |
| 5 years | 0.08 % |
The average dividend growth is 0.08 % over 5 years. This shows moderate but steady dividend growth.
⚠️ Payout Ratio
The payout ratio is a critical determinant of a company's dividend sustainability. Bristol-Myers Squibb shows varying stability in this aspect, influencing investor confidence.
| Key figure | Ratio |
|---|---|
| EPS-based | 96.70 % |
| Free cash flow-based | 33.50 % |
A payout ratio of 96.70 % (EPS) is concerning, particularly alongside a 33.50 % (FCF). This implies tighter control over cash reserves, potentially affecting future dividend decisions.
📊 Cashflow & Capital Efficiency
The cash flow dynamics and capital efficiency metrics highlight a firm's capability to sustain operations while rewarding shareholders. Bristol-Myers Squibb maintains a competitive edge through its capital management.
| Metric | 2024 | 2023 | 2022 |
|---|---|---|---|
| Free Cash Flow Yield | 12.16 % | 11.92 % | 7.80 % |
| Earnings Yield | -7.80 % | 7.56 % | 4.13 % |
| CAPEX to Operating Cash Flow | 8.32 % | 8.72 % | 8.56 % |
| Stock-based Compensation to Revenue | 1.05 % | 1.15 % | 0.99 % |
| Free Cash Flow / Operating Cash Flow Ratio | 91.78 % | 91.28 % | 91.44 % |
The figures illustrate an agile yet cautious approach to cash flow management, presenting ongoing capabilities to uphold operational expenditures.
📉 Balance Sheet & Leverage Analysis
Examining Bristol-Myers Squibb's balance sheet and leverage highlights the firm's financial health, crucial for assessing sustainability under various economic conditions.
| Metric | 2024 | 2023 | 2022 |
|---|---|---|---|
| Debt-to-Equity | 313.44 % | 140.89 % | 131.09 % |
| Debt-to-Assets | 55.29 % | 43.57 % | 42.05 % |
| Debt-to-Capital | 75.81 % | 58.49 % | 56.73 % |
| Net Debt to EBITDA | 12.90 | 1.55 | 1.64 |
| Current Ratio | 1.25 | 1.43 | 1.25 |
| Quick Ratio | 1.15 | 1.31 | 1.14 |
| Financial Leverage | 5.67 | 3.23 | 3.12 |
The leverage statistics warrant caution, with high debt impacting financial flexibility. Proactive efforts to rebalance may be required to ensure long-term viability.
✅ Fundamental Strength & Profitability
The core operating performance and profitability metrics provide an indication of the firm’s ability to generate consistent returns and manage expenditures efficiently.
| Metric | 2024 | 2023 | 2022 |
|---|---|---|---|
| Return on Equity | -54.78 % | 27.27 % | 20.37 % |
| Return on Assets | -9.66 % | 8.43 % | 6.53 % |
| Margins: Net | -18.53 % | 17.83 % | 13.71 % |
| EBIT | -13.32 % | 21.34 % | 19.38 % |
| EBITDA | 6.56 % | 43.03 % | 41.64 % |
| Gross Margin | 56.80 % | 56.34 % | 57.39 % |
| R&D to Revenue | 20.25 % | 20.46 % | 20.39 % |
Despite recent setbacks reflected in the profitability metrics, strong R&D investment indicates a strategic focus on innovation and future growth potential.
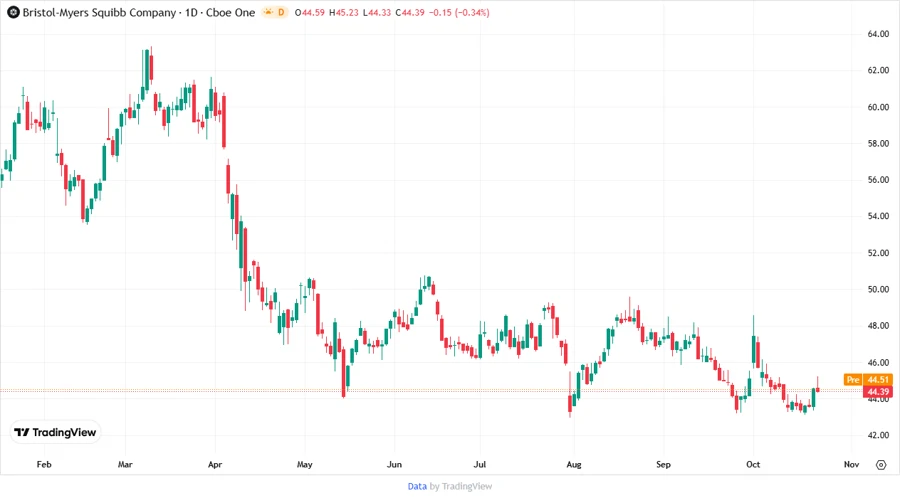
📈 Price Development
🗣️ Dividend Scoring System
| Category | Score | Score Bar |
|---|---|---|
| Dividend yield | 4 | |
| Dividend Stability | 2 | |
| Dividend growth | 3 | |
| Payout ratio | 2 | |
| Financial stability | 2 | |
| Dividend continuity | 3 | |
| Cashflow Coverage | 3 | |
| Balance Sheet Quality | 2 |
Total Score: 21/40
🗣️ Rating
Bristol-Myers Squibb Company retains potential as an income-focused investment through its attractive dividend yield and historical backing. Despite recent financial pressures, the ongoing efforts in R&D imply avenues for rejuvenation and growth. Investors should maintain prudent optimism, keeping a vigilant eye on payout stability and leverage management.
Smart Data Insight
Master the Perfect Entry & Exit for this Stock
Don't leave your profits to chance. Historically, this stock follows specific seasonal patterns that institutional traders use to maximize returns.
- ✅ Identify the "Golden Buying Window"
- ✅ Avoid high-risk correction cycles
- ✅ Backtested data from the last 20+ years