June 20, 2026 a 08:15 am

BLK: Trend and Support & Resistance Analysis - BlackRock, Inc.
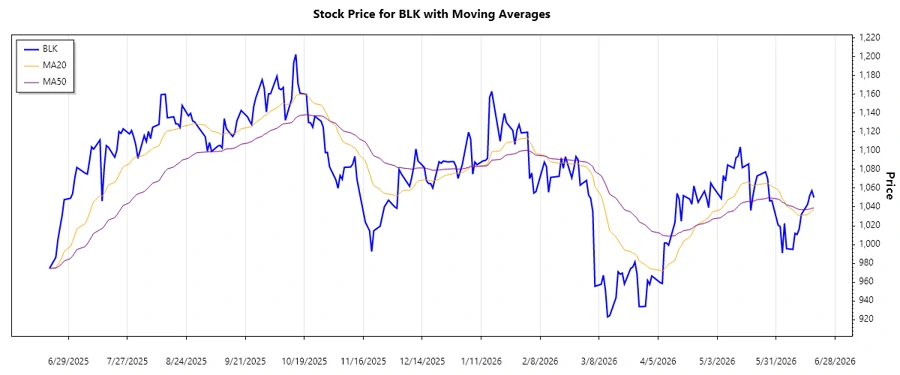
The analysis of BlackRock, Inc. (BLK) indicates a recent recovery in stock prices, showing a change in sentiment from bearish conditions observed earlier this year. Technical indicators such as moving averages suggest a cautious optimism as prices hover around resistance levels. Continued observation of price action near identified support and resistance zones will be critical for future predictions. Strategic investment by the firm in diverse markets and strong asset management positioning might lead to potential growth opportunities.
Trend Analysis
Analyzing the recent trend of BlackRock, Inc. stock, we observe a volatile environment with fluctuations that have recently leaned towards an upward trend. Calculating the Exponential Moving Averages (EMA) for the recent closing prices:
| Date | Closing Price | Trend |
|---|---|---|
| 2026-06-18 | 1050.09 | ▲ |
| 2026-06-17 | 1057.38 | ▲ |
| 2026-06-16 | 1052.23 | ▲ |
| 2026-06-15 | 1042.87 | ▼ |
| 2026-06-12 | 1032.00 | ▼ |
| 2026-06-11 | 1016.58 | ▼ |
| 2026-06-10 | 1010.68 | ▼ |
The recent bullish action can be corroborated by EMA calculations, where EMA20 might be crossing above EMA50, indicating a newfound optimism. Such movements signal possible continued upward pricing in the near future.
Support and Resistance
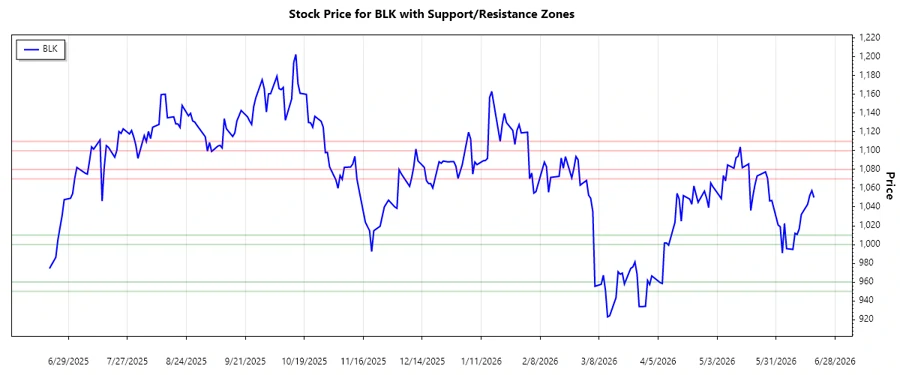
Based on historical data, the following support and resistance zones have been identified for BlackRock, Inc.:
| Zone Type | From | To |
|---|---|---|
| Support 1 | 1000.00 | 1010.00 |
| Support 2 | 950.00 | 960.00 |
| Resistance 1 | 1070.00 | 1080.00 |
| Resistance 2 | 1100.00 | 1110.00 |
Currently, the stock trades near the first resistance zone, suggesting a potential breakout region that could pave the way for higher resistance tests.
Conclusion
The BlackRock, Inc. stock has shown promising recovery signs, hinting at a potential bullish trend should it consolidate above critical resistance levels. While market volatility may still pose challenges, the current setup offers opportunities for investors seeking value in robust asset management companies. Continued observation along the support and resistance lines will provide vital cues for strategic investment decisions. Analysts might view this phase as pivotal for establishing positions, given the risk-to-reward scenarios evident from historical data analysis.
Smart Data Insight
Master the Perfect Entry & Exit for this Stock
Don't leave your profits to chance. Historically, this stock follows specific seasonal patterns that institutional traders use to maximize returns.
- ✅ Identify the "Golden Buying Window"
- ✅ Avoid high-risk correction cycles
- ✅ Backtested data from the last 20+ years