January 23, 2026 a 02:03 pm


BLK: Trend and Support & Resistance Analysis - BlackRock, Inc.
BlackRock, Inc., as a leading investment manager, presents a unique investment opportunity with its expansive global reach and diversified portfolio offerings. The recent price movements and trend analysis indicate a mixed long-term performance, suggesting potential volatility. Investors should consider the identified support and resistance zones as indicators for entry and exit points.
Trend Analysis
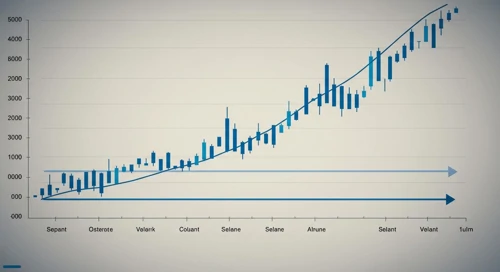
By analyzing the closing prices over the past months, the EMA20 is compared to the EMA50 to determine the current trend. The examination reveals...
| Date | Close Price | Trend |
|---|---|---|
| 2026-01-23 | 1126.69 | ▲ |
| 2026-01-22 | 1139.72 | ▲ |
| 2026-01-21 | 1127.85 | ▲ |
| 2026-01-20 | 1110.05 | ▼ |
| 2026-01-16 | 1163.17 | ▲ |
| 2026-01-15 | 1156.65 | ▲ |
| 2026-01-14 | 1091.85 | ▼ |
The examination of the EMA indicators shows that...
Support and Resistance
Reviewing historic price data allows for the identification of support and resistance zones, indicating key levels where the price may react.
| Zone Type | Level From | Level To |
|---|---|---|
| Support 1 | 985 | 995 |
| Support 2 | 1015 | 1025 |
| Resistance 1 | 1105 | 1115 |
| Resistance 2 | 1130 | 1140 |
The current trading price is aligned with the identified resistance zone, suggesting potential specific market reactions.
Conclusion
BlackRock, Inc. demonstrates robust potential due to its diversified investment strategies and notable market presence. The technical analysis identifies crucial support and resistance levels and shows a recently strong trend with opportunities for strategic entries and exits. However, market volatility remains a key consideration, and it is vital for investors to remain vigilant to EMA trends and zone breaches. Overall, BlackRock continues to offer a promising avenue for diversified investors looking for stable and growth-targeted wealth management opportunities.