July 19, 2025 a 01:15 pm

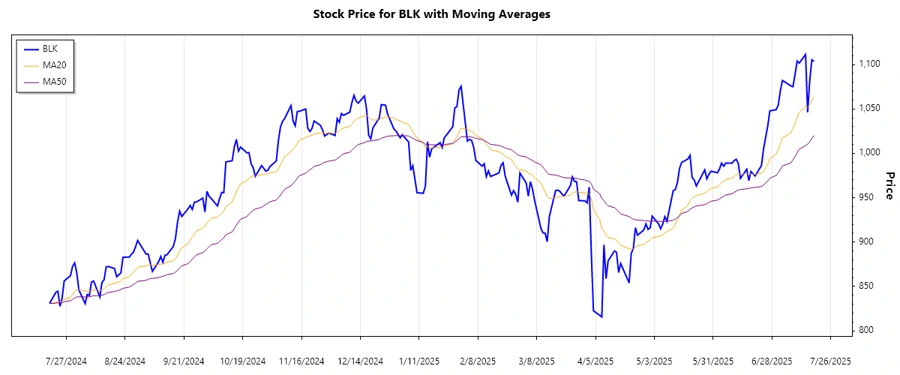

BLK: Trend and Support & Resistance Analysis - BlackRock, Inc.
BlackRock, Inc., as a prominent investment manager, holds a significant position in global finance. The recent price movements suggest a complex dynamic influenced by various market factors. This analysis aims to shed light on the potential trends and pivotal price zones that could define its short to medium-term trading outlook.
Trend Analysis
| Date | Closing Price (USD) | Trend |
|---|---|---|
| 2025-07-18 | 1103.59 | ▲ |
| 2025-07-17 | 1105.38 | ▲ |
| 2025-07-16 | 1082.24 | ▲ |
| 2025-07-15 | 1046.16 | ▲ |
| 2025-07-14 | 1111.46 | ▲ |
| 2025-07-11 | 1101.64 | ▲ |
| 2025-07-10 | 1104.05 | ▲ |
The recent data shows a predominant upward trend, resembling bullish characteristics as the EMA20 surpasses EMA50, reflecting favorable market conditions for BlackRock's stock.
Support and Resistance
| Zone Type | From (USD) | To (USD) |
|---|---|---|
| Support | 975.00 | 989.00 |
| Support | 1004.00 | 1018.00 |
| Resistance | 1075.00 | 1100.00 |
| Resistance | 1112.00 | 1125.00 |
The current price level is marginally above a key resistance zone, indicating potential for further gains if broken, though further consolidation may occur if resisted.
Conclusion
The BlackRock, Inc. stock demonstrates strong upward momentum, supported by positive trend indicators. However, it is encountering resistance levels that may decelerate its upward journey unless breached significantly. Analysts should weigh these trends against macroeconomic factors affecting BlackRock's diverse investment spectrum. Ongoing monitoring of support and resistance levels is crucial to anticipate potential reversals or confirmations of the current trend.
Smart Data Insight
Master the Perfect Entry & Exit for this Stock
Don't leave your profits to chance. Historically, this stock follows specific seasonal patterns that institutional traders use to maximize returns.
- ✅ Identify the "Golden Buying Window"
- ✅ Avoid high-risk correction cycles
- ✅ Backtested data from the last 20+ years