April 26, 2026 a 03:31 pm

BLK: Dividend Analysis - BlackRock, Inc.
📊 BlackRock, Inc. stands as a keystone in asset management, distinguished by a robust dividend profile and commitment to shareholder returns. The company’s enduring dividend history underscores its financial prudence and dedication to sustained growth. This analysis explores key dividend metrics and financial ratios, providing insight into BlackRock's strategic position in navigating market challenges while delivering investor value.
Overview
🗣️ BlackRock, a major player in the financial sector, showcases an impressive dividend yield of 2.23% with a current dividend per share of $21.58. Having a substantial dividend history spanning 24 years without recent cuts or suspensions highlights its stable dividend outlook and strategic financial management.
| Factor | Details |
|---|---|
| Sector | Financial |
| Dividend Yield | 2.23 % |
| Current Dividend per Share | $21.58 |
| Dividend History | 24 years |
| Last Cut or Suspension | None |
Dividend History
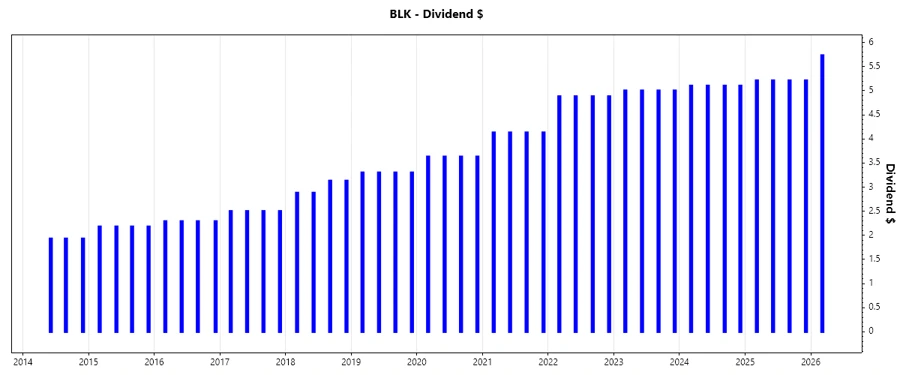
📈 Analyzing BlackRock’s recent dividend distributions reveals a strong trajectory of increasing payouts. This consistency is pivotal for investors prioritizing income, reflecting the company’s financial resilience and commitment to distributing profits to shareholders.
| Year | Dividend per Share (USD) |
|---|---|
| 2026 | 5.73 |
| 2025 | 20.84 |
| 2024 | 20.40 |
| 2023 | 20.00 |
| 2022 | 19.52 |
Dividend Growth
📈 BlackRock has demonstrated a modest but steady growth pattern over the past years. The 3-year dividend growth rate stands at 2.21%, while a longer-term view shows a 5-year growth rate of 7.49%. This growth underscores the potential for gradually increasing income streams for investors.
| Time | Growth |
|---|---|
| 3 years | 2.21 % |
| 5 years | 7.49 % |
The average dividend growth is 7.49 % over 5 years. This shows moderate but steady dividend growth.
Payout Ratio
📉 The payout ratios for BlackRock highlight its approach to managing shareholder payouts while retaining earnings for growth. With an EPS-based payout ratio of 53.58% and FCF-based ratio of 93.47%, the company reflects a strong capacity to maintain its dividend policy without compromising fiscal health.
| Ratio | Percentage |
|---|---|
| EPS-based | 53.58 % |
| Free Cash Flow-based | 93.47 % |
The EPS payout ratio of 53.58% is acceptable, reflecting a balanced approach to dividend distribution and growth funding. The high FCF payout suggests strategic reinvestment to drive future profitability while maintaining shareholder returns.
Cashflow & Capital Efficiency
✅ Analyzing BlackRock’s cash flow provides insights into operational efficiency and financial health. With a free cash flow yield of 2.21% and a robust earnings yield of 3.85%, the metrics affirm sustained operational efficiency. Furthermore, assessing capital efficiency through key ratios such as CAPEX to operating cash flow provides a crucial measure of BlackRock’s investment in future productivity and growth.
| Factor | 2023 | 2024 | 2025 |
|---|---|---|---|
| Free Cash Flow Yield | 2.31% | 3.05% | 2.26% |
| Earnings Yield | 4.54% | 4.14% | 3.34% |
| CAPEX to Operating Cash Flow | 8.25% | 5.15% | 9.09% |
| Stock-based Compensation to Revenue | 3.53% | 3.68% | 0% |
| Free Cash Flow / Operating Cash Flow Ratio | 91% | 95% | 90% |
The consistency in cash flow ratios underscores BlackRock's strong capital management and efficiency. The stability of free cash flow ratios suggests reliable operational funding while maintaining future growth prospects via strategic CAPEX allocations.
Balance Sheet & Leverage Analysis
⚠️ BlackRock's balance sheet strength underpins its leverage approaches. The Debt-to-Equity ratio of 0.25 signals disciplined leverage use, supporting growth without financial strain. Monitoring leverage ratios like Debt-to-Capital provides an understanding of its capital structure's robustness.
| Ratio | 2023 | 2024 | 2025 |
|---|---|---|---|
| Debt-to-Equity | 0.25 | 0.30 | 0.27 |
| Debt-to-Assets | 7.87% | 10.26% | 8.82% |
| Debt-to-Capital | 19.78% | 23.04% | 21.16% |
| Net Debt to EBITDA | 0.14 | 0.18 | 0.41 |
| Current Ratio | 15.63 | 16.40 | 15.76 |
| Quick Ratio | 15.63 | 16.40 | 15.76 |
| Financial Leverage | 3.13 | 2.92 | 3.04 |
BlackRock's financial leverage and liquidity ratios indicate strong asset management and debt-control strategies, suggesting a healthy risk mitigation approach and operational resilience.
Fundamental Strength & Profitability
📈 BlackRock emphasizes robust profitability metrics, evidenced by steady returns on equity and assets. Margins remain competitive, further solidifying its market-leading position in asset management.
| Factor | 2023 | 2024 | 2025 |
|---|---|---|---|
| Return on Equity | 13.98% | 13.41% | 9.94% |
| Return on Assets | 4.47% | 4.59% | 3.27% |
| Net Margin | 30.81% | 31.21% | 22.93% |
| EBIT Margin | 35.53% | 37.62% | 32.25% |
| EBITDA Margin | 37.92% | 40.22% | 34.99% |
| Gross Margin | 48.05% | 49.42% | 55.52% |
| Research & Development to Revenue | 3.40% | 3.30% | 0% |
The company's fundamentals and profitability metrics indicate strong financial health and strategy execution, particularly in maximizing equity returns and maintaining competitive margins.
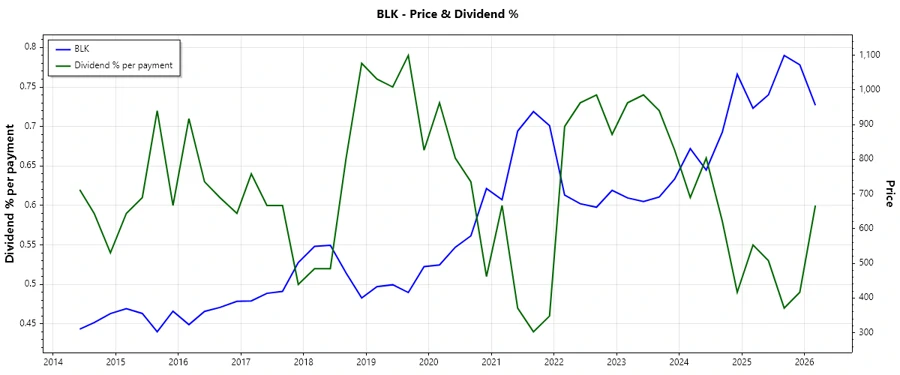
Price Development
Dividend Scoring System
| Category | Score (1-5) | Score Bar |
|---|---|---|
| Dividend yield | 4 | |
| Dividend Stability | 5 | |
| Dividend growth | 3 | |
| Payout ratio | 3 | |
| Financial stability | 4 | |
| Dividend continuity | 5 | |
| Cashflow Coverage | 4 | |
| Balance Sheet Quality | 5 |
Total Score: 33/40
Rating
✅ BlackRock, Inc. presents a solid investment option for dividend-seeking investors. Its reliable dividend history, coupled with solid financial metrics, underscored by robust balance sheet management and efficient capital deployment, suggests sustained shareholder value amidst market fluctuations. The recommendation is positive, aligning with its strategic financial trajectory and market positioning.