March 17, 2026 a 12:46 pm

BLK: Dividend Analysis - BlackRock, Inc.
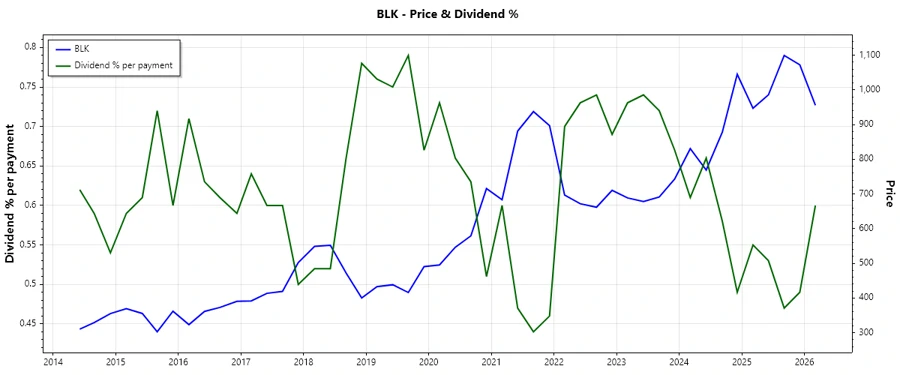
BlackRock, Inc. demonstrates a promising dividend profile with consistent growth and stability in its payouts. The company has maintained a robust position with a dividend yield of 2.24% and a consistent dividend history over the last 24 years. Such stability makes it a strong consideration for dividend-focused portfolios.
📊 Overview
BlackRock operates in the financial services sector, showcasing a clear commitment to shareholder returns through dividends. With a history of 24 years of uninterrupted dividends, the company has never cut or suspended its payouts, reflecting robust financial health.
| Key Metric | Value |
|---|---|
| Sector | Financial Services |
| Dividend Yield | 2.24 % |
| Current Dividend per Share | 21.58 USD |
| Dividend History | 24 years |
| Last Cut or Suspension | None |
🗣️ Dividend History
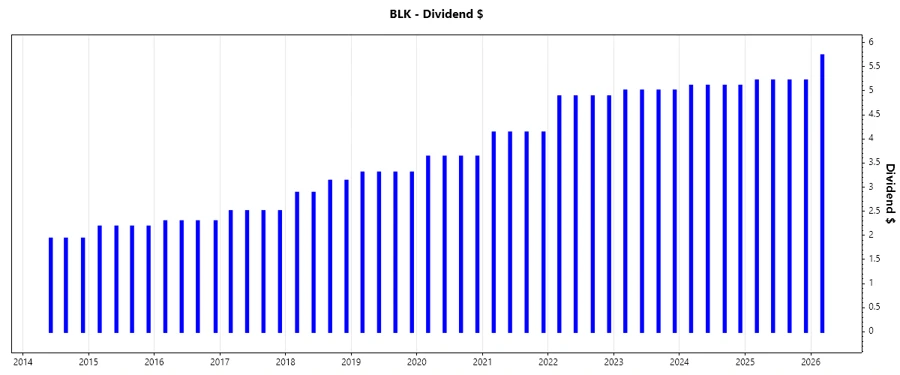
Understanding BlackRock's dividend history helps investors gauge the company's commitment to returning value to shareholders. A consistent dividend is a testament to financial stability. Below is the visual representation of recent payouts alongside a detailed table of dividends paid.
| Year | Dividend per Share (USD) |
|---|---|
| 2026 | 5.73 |
| 2025 | 20.84 |
| 2024 | 20.40 |
| 2023 | 20.00 |
| 2022 | 19.52 |
📈 Dividend Growth
Examining dividend growth offers insights into BlackRock's potential for increasing returns. Steady growth over several years can indicate an improving or stable business.
| Time | Growth |
|---|---|
| 3 years | 2.21 % |
| 5 years | 7.49 % |
The average dividend growth is 7.49 % over 5 years. This shows moderate but steady dividend growth.
📉 Payout Ratio
The payout ratio shows how much of the company's earnings are being used to pay dividends. Monitoring these ratios ensures dividends are sustainable alongside growth.
| Key Figure | Value |
|---|---|
| EPS-based | 60.27 % |
| Free Cash Flow-based | 93.47 % |
With an EPS-based payout ratio of 60.27% and an FCF-based payout ratio of 93.47%, BlackRock is utilizing a large portion of its cash flow for dividends, which should be closely monitored for future growth capacity.
✅ Cashflow & Capital Efficiency
Cash flow and capital efficiency are crucial indicators of a company's ability to generate cash to support operations and dividends.
| Metric | 2023 | 2024 | 2025 |
|---|---|---|---|
| Free Cash Flow Yield | 3.15% | 3.06% | 2.26% |
| Earnings Yield | 4.54% | 4.14% | 3.34% |
| CAPEX to Operating Cash Flow | 8.26% | 5.15% | 9.05% |
| Stock-based Compensation to Revenue | 3.53% | 3.69% | 0.00% |
| Free Cash Flow / Operating Cash Flow Ratio | 91.74% | 94.85% | 90.91% |
BlackRock maintains a healthy cash position allowing for effective dividend payments, though aggressive capital expenditure may constrain cash flow improvements.
⚠️ Balance Sheet & Leverage Analysis
The company's balance sheet reveals its liquidity position and financial health, essential for understanding leverage and long-term viability.
| Metric | 2023 | 2024 | 2025 |
|---|---|---|---|
| Debt-to-Equity | 24.66% | 29.94% | 26.83% |
| Debt-to-Assets | 7.87% | 10.26% | 8.82% |
| Debt-to-Capital | 19.78% | 23.04% | 21.16% |
| Net Debt-to-EBITDA | 14.26% | 17.79% | 41.63% |
| Current Ratio | 15.63 | 16.40 | 70.15 |
| Quick Ratio | 15.63 | 16.40 | 70.15 |
| Financial Leverage | 3.13 | 2.92 | 3.04 |
BlackRock showcases strong financial stability and prudence in its leverage, standing out with considerable liquidity reserves which reduces financial risk.
🗣️ Fundamental Strength & Profitability
BlackRock's profitability ratios signify the firm's ability to generate profits from its operations which is pivotal for sustainable growth and dividend payments.
| Metric | 2023 | 2024 | 2025 |
|---|---|---|---|
| Return on Equity | 13.98% | 13.41% | 9.94% |
| Return on Assets | 4.47% | 4.59% | 3.27% |
| Net Margin | 30.81% | 31.21% | 22.93% |
| EBIT Margin | 35.53% | 37.62% | 32.25% |
| EBITDA Margin | 37.92% | 40.22% | 34.99% |
| Gross Margin | 48.05% | 49.42% | 55.52% |
| Research & Development to Revenue | 3.40% | 3.30% | 0.78% |
Strong profit margins across the board underscore BlackRock's operational efficiency and its capacity to maintain high dividend payouts while exploring new growth avenues.
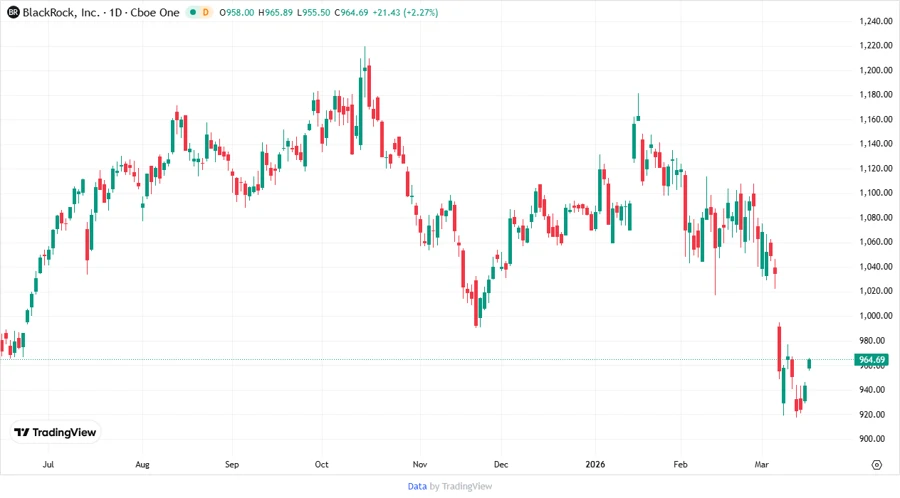
📈 Price Development
📉 Dividend Scoring System
| Criteria | Score | Score Bar |
|---|---|---|
| Dividend Yield | 4 | |
| Dividend Stability | 5 | |
| Dividend Growth | 3 | |
| Payout Ratio | 3 | |
| Financial Stability | 5 | |
| Dividend Continuity | 5 | |
| Cashflow Coverage | 4 | |
| Balance Sheet Quality | 5 |
Overall Score: 34/40
✅ Rating
BlackRock, Inc. provides a blend of stability and sustainable dividend growth, making it an appealing choice for income-focused investors. With a strong financial foundation, well-managed leverage, and extensive dividend payment history, BlackRock stands as a reliable investment in the financial services sector.
Smart Data Insight
Master the Perfect Entry & Exit for this Stock
Don't leave your profits to chance. Historically, this stock follows specific seasonal patterns that institutional traders use to maximize returns.
- ✅ Identify the "Golden Buying Window"
- ✅ Avoid high-risk correction cycles
- ✅ Backtested data from the last 20+ years