March 15, 2026 a 03:31 am

BLK: Dividend Analysis - BlackRock, Inc.
BlackRock, Inc., with its impressive track record of consistent dividend payments over 24 years, stands as a stalwart in dividend-paying equities. The company's robust dividend yield of 2.24% coupled with a steady growth over recent years underscores its commitment to rewarding shareholders. While the recent dividend growth suggests moderate acceleration, the firm’s prudent payout ratios ensure financial resilience amidst market volatility.
📊 Overview
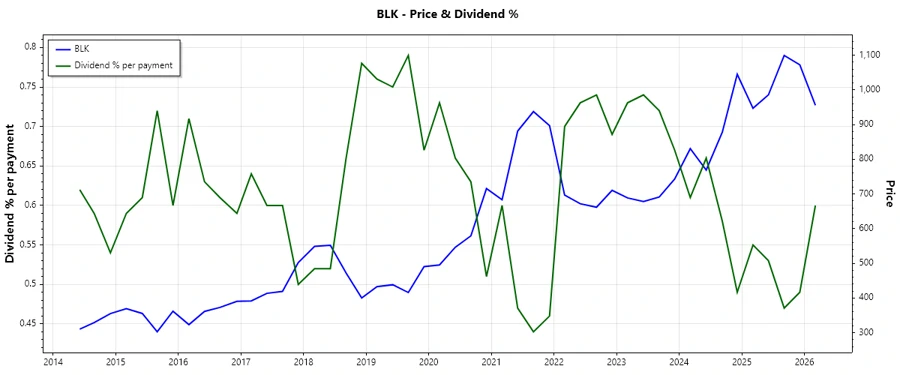
BlackRock operates in the financial sector, where dividend yield and stability are often the hallmark of robust performance metrics. The company currently delivers a substantial yield of 2.24%, supported by its historical commitment to dividends spanning 24 years without interruptions.
| Metric | Value |
|---|---|
| Sector | Financials |
| Dividend yield | 2.24 % |
| Current dividend per share | $21.58 USD |
| Dividend history | 24 years |
| Last cut or suspension | None |
📈 Dividend History
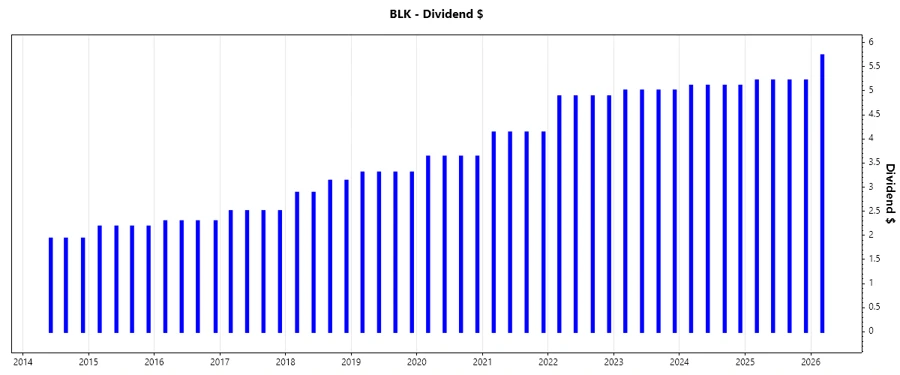
The company's dividend history reflects its dedication to consistent shareholder returns, with a notable absence of dividend cuts in the last 24 years—a critical factor for risk-averse investors.
| Year | Dividend per Share |
|---|---|
| 2026 | $5.73 |
| 2025 | $20.84 |
| 2024 | $20.40 |
| 2023 | $20.00 |
| 2022 | $19.52 |
💹 Dividend Growth
The historical dividend growth rates highlight an incremental approach to value creation for shareholders. Over the past 5 years, BlackRock has seen a moderate growth rate of 7.49%, reflecting its commitment to long-term dividend increases.
| Time | Growth |
|---|---|
| 3 years | 2.21 % |
| 5 years | 7.49 % |
The average dividend growth is 7.49% over 5 years. This shows moderate but steady dividend growth.
🔍 Payout Ratio
Payout ratios are critical to assessing the sustainability of dividend payments. BlackRock exhibits an EPS-based payout ratio of 60.27% and a free cash flow-based ratio of 93.47%, suggesting robust, albeit comprehensive, coverage of dividends from cash flows.
| Key figure | Ratio |
|---|---|
| EPS-based | 60.27 % |
| Free cash flow-based | 93.47 % |
The ratios indicate that while the dividend is comfortably covered by earnings, the reliance on free cash flow is significant. Both metrics, however, exhibit BlackRock’s capacity to maintain its dividend policy.
🚀 Cashflow & Capital Efficiency
Analyzing cash flow and capital efficiency metrics is imperative to evaluate a company's liquidity and operational efficiency. BlackRock's figures reflect a strategic deployment of capital and cash management.
| Year | 2023 | 2024 | 2025 |
|---|---|---|---|
| Free Cash Flow Yield | 3.15% | 3.06% | 2.26% |
| Earnings Yield | 4.54% | 4.14% | 3.34% |
| CAPEX to Operating Cash Flow | 8.26% | 5.15% | 9.05% |
| Stock-based Compensation to Revenue | 3.53% | 3.69% | 0% |
| Free Cash Flow / Operating Cash Flow Ratio | 91.74% | 94.85% | 90.91% |
The cash flow figures indicate a capacity for sustaining dividends, supporting strategic investments without compromising liquidity positions.
📉 Balance Sheet & Leverage Analysis
The balance sheet's strength, coupled with leverage analysis, provides insights into financial health and the capacity to meet long-term obligations.
| Year | 2023 | 2024 | 2025 |
|---|---|---|---|
| Debt-to-Equity | 24.66% | 29.94% | 26.83% |
| Debt-to-Assets | 7.87% | 10.26% | 8.82% |
| Debt-to-Capital | 19.78% | 23.04% | 21.16% |
| Net Debt to EBITDA | 0.143x | 0.178x | 0.416x |
| Current Ratio | 15.63 | 16.40 | 70.15 |
| Quick Ratio | 15.63 | 16.40 | 70.15 |
| Financial Leverage | 3.13 | 2.92 | 3.04 |
The balance sheet depicts a strong financial standing with manageable leverage ratios, highlighting resilience against economic fluctuations.
📈 Fundamental Strength & Profitability
These metrics are cardinal in assessing BlackRock’s profitability and operational prowess. Insights into profitability help ascertain the efficiency of capital allocation.
| Year | 2023 | 2024 | 2025 |
|---|---|---|---|
| Return on Equity | 13.98% | 13.41% | 9.94% |
| Return on Assets | 4.47% | 4.59% | 3.27% |
| Net Margin | 30.81% | 31.21% | 22.93% |
| EBIT Margin | 35.53% | 37.62% | 32.25% |
| EBITDA Margin | 37.92% | 40.22% | 34.99% |
| Gross Margin | 48.05% | 49.42% | 55.52% |
| R&D to Revenue | 3.40% | 3.30% | 0.78% |
Remarkable profitability metrics highlight BlackRock’s efficient use of resources and innovative strategies. These ratios position the company favorably in terms of competitiveness and market adaptability.
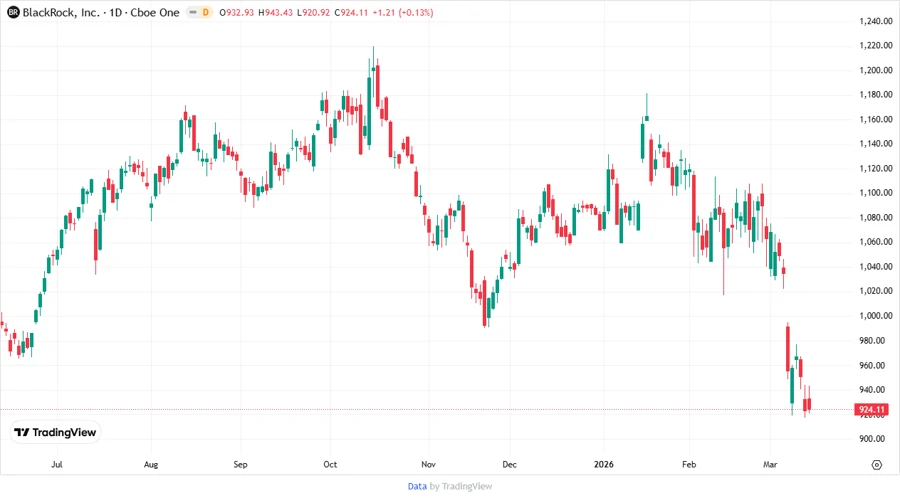
🌟 Price Development
🏅 Dividend Scoring System
| Criteria | Score (1-5) | Score Bar |
|---|---|---|
| Dividend yield | 4 | |
| Dividend Stability | 5 | |
| Dividend growth | 3 | |
| Payout ratio | 4 | |
| Financial stability | 5 | |
| Dividend continuity | 5 | |
| Cashflow Coverage | 4 | |
| Balance Sheet Quality | 5 |
Total Score: 35/40
🔎 Rating
BlackRock, Inc. exemplifies robustness and reliability in its dividend profile. With a superior total dividend score and consistent dividend payment history, it remains an attractive proposition for income-focused investors. The sustainable payout ratio and strong financial metrics fortify its prudent fiscal strategies. Recommendation: Consider for portfolio diversification and income generation.
Smart Data Insight
Master the Perfect Entry & Exit for this Stock
Don't leave your profits to chance. Historically, this stock follows specific seasonal patterns that institutional traders use to maximize returns.
- ✅ Identify the "Golden Buying Window"
- ✅ Avoid high-risk correction cycles
- ✅ Backtested data from the last 20+ years