February 11, 2026 a 03:31 am

BLK: Dividend Analysis - BlackRock, Inc.
BlackRock, Inc., a leader in asset management, showcases a stable dividend sheet with consistent growth and significant financial health. Their commitment to shareholders is visible through uninterrupted payouts and strategic capital allocation.
📊 Overview
BlackRock operates within the financial sector and maintains a dividend yield of 1.96%, reflecting consistent returns to shareholders. With a current dividend per share of $20.84 and 24 years of dividend history, BlackRock marks its reliability with no recent cuts or suspensions.
| Factor | Value |
|---|---|
| Sector | Financial Services |
| Dividend Yield | 1.96 % |
| Current Dividend Per Share | 20.84 USD |
| Dividend History | 24 years |
| Last Cut or Suspension | None |
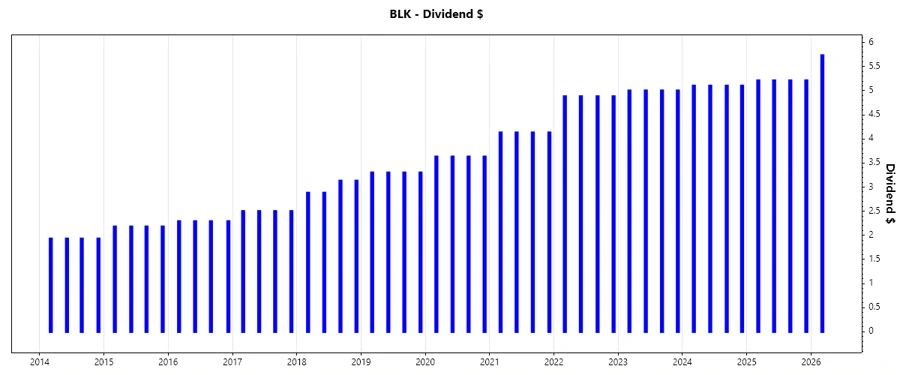
🗣️ Dividend History
Having a solid dividend history signifies stability and shareholder trust, underlined by uninterrupted payouts even during economic adversities. This not only strengthens investor confidence but also showcases strategic management foresight.
| Year | Dividend Per Share (USD) |
|---|---|
| 2026 | 5.73 |
| 2025 | 20.84 |
| 2024 | 20.4 |
| 2023 | 20 |
| 2022 | 19.52 |
📈 Dividend Growth
Growth in dividends indicates a company’s confidence in its future cash flows. With a 3-year growth rate of 2.21% and 5-year growth at 7.49%, BlackRock’s average dividend growth illustrates moderate but steady enhancement, strengthening its financial robustness.
| Time | Growth |
|---|---|
| 3 years | 2.21 % |
| 5 years | 7.49 % |
The average dividend growth is 7.49% over 5 years. This shows moderate but steady dividend growth.
💰 Payout Ratio
Analyzing payout ratios provides insights into sustainability and impact on future growth. BlackRock’s EPS-based ratio at 58.21% and a FCF-based ratio at 82.21% reflect an adequately balanced approach essential for growth and dividends.
| Key Figure | Ratio |
|---|---|
| EPS-based | 58.21 % |
| Free cash flow-based | 82.21 % |
The EPS ratio suggests disciplined payout balancing reinvestment, while the FCF ratio highlights a focus on cash flow sufficiency.
📉 Cashflow & Capital Efficiency
Understanding capital efficiency is crucial for evaluating a firm’s ability to convert investments into revenue and growth. BlackRock maintains a robust free cash flow yield alongside efficient CAPEX management. These metrics depict financial prudence coupled with strategic investment in future capabilities.
| Metric | 2023 | 2024 | 2025 |
|---|---|---|---|
| Free Cash Flow Yield | 3.15% | 3.06% | 0% |
| Earnings Yield | 4.54% | 4.14% | 3.34% |
| CAPEX to Operating Cash Flow | 8.26% | 5.15% | 0% |
| Stock-based Compensation to Revenue | 3.53% | 3.69% | 0% |
| Free Cash Flow/Operating Cash Flow Ratio | 91.74% | 94.85% | 0% |
These results indicate a strong capacity for operational efficiency and sustainable cash flow management.
🔍 Balance Sheet & Leverage Analysis
Evaluating leverage provides insight into BlackRock’s financial resiliency and debt service capabilities. Their improving debt metrics alongside a high current ratio indicate strong liquidity and mitigated risks of over-leverage.
| Metric | 2023 | 2024 | 2025 |
|---|---|---|---|
| Debt-to-Equity | 24.66% | 29.94% | 0% |
| Debt-to-Assets | 7.87% | 10.26% | 0% |
| Debt-to-Capital | 19.78% | 23.04% | 0% |
| Net Debt to EBITDA | 0.14 | 0.18 | 0 |
| Current Ratio | 15.63 | 16.40 | 0 |
Stability in these metrics underscores BlackRock's financial resilience and efficient leverage management, reducing potential financial risk.
🏢 Fundamental Strength & Profitability
Robust profitability metrics are vital for long-term value creation. BlackRock displays solid returns on both equity and assets, signaling efficient asset utilization and strong profit generation capabilities.
| Metric | 2023 | 2024 | 2025 |
|---|---|---|---|
| Return on Equity | 13.98% | 13.41% | 0% |
| Return on Assets | 4.47% | 4.59% | 0% |
| Net Margin | 30.81% | 31.21% | 22.93% |
| EBIT Margin | 35.53% | 37.62% | 32.25% |
These metrics confirm BlackRock's operational efficiency and robust profitability, thereby reinforcing investor confidence.
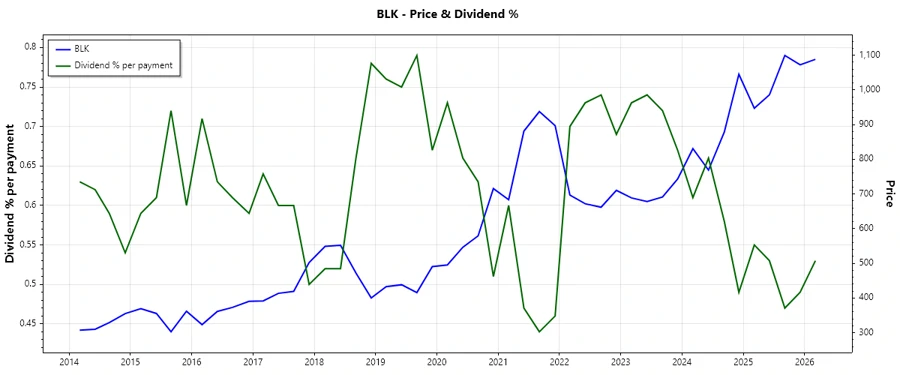
📉 Price Development
✅ Dividend Scoring System
| Metric | Score (1-5) | Score Bar |
|---|---|---|
| Dividend Yield | 3 | |
| Dividend Stability | 4 | |
| Dividend Growth | 3 | |
| Payout Ratio | 4 | |
| Financial Stability | 5 | |
| Dividend Continuity | 5 | |
| Cashflow Coverage | 4 | |
| Balance Sheet Quality | 5 |
Total Score: 33/40
⭐ Rating
BlackRock presents a compelling dividend profile characterized by stability, growth, and fiscal strength. Its comprehensive strategic initiatives are evident through solid profitability metrics and prudent capital management. I recommend considering BlackRock as part of a balanced portfolio for dividends and stability.
Smart Data Insight
Master the Perfect Entry & Exit for this Stock
Don't leave your profits to chance. Historically, this stock follows specific seasonal patterns that institutional traders use to maximize returns.
- ✅ Identify the "Golden Buying Window"
- ✅ Avoid high-risk correction cycles
- ✅ Backtested data from the last 20+ years