February 03, 2026 a 12:46 pm


BLK: Dividend Analysis - BlackRock, Inc.
BlackRock, Inc. demonstrates a robust dividend profile with steady growth over the years. It is a prime candidate for income-focused investors due to its consistent dividend history and favorable market cap. However, potential investors should consider the relatively high payout ratios, which may constrain future dividend increases unless earnings also grow.
📊 Overview
BlackRock operates within the financial sector, consistently providing dividends evaluated at a 1.91% yield. With a current dividend per share of $20.84 and a strong dividend history over 24 years, it signifies robust dividend continuity without any recent suspensions.
| Sector | Dividend yield | Current dividend per share | Dividend history | Last cut or suspension |
|---|---|---|---|---|
| Financial | 1.91% | $20.84 USD | 24 years | None |
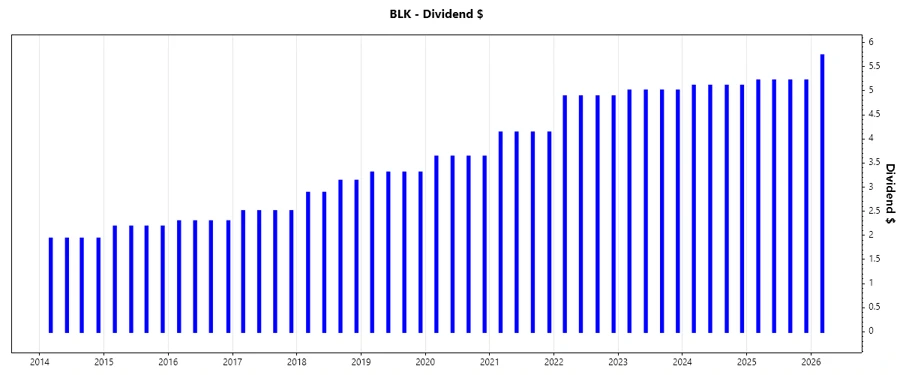
🗣️ Dividend History
Understanding a company’s dividend history is critical; it reflects its commitment to returning value to shareholders. BlackRock’s consistent dividend payment over numerous years presents a stable investment option.
Five most recent dividend payments highlight continuity:
| Year | Dividend per Share (USD) |
|---|---|
| 2026 | $5.73 |
| 2025 | $20.84 |
| 2024 | $20.4 |
| 2023 | $20 |
| 2022 | $19.52 |
📈 Dividend Growth
Dividend growth rates provide insight into a company's future income prospects for its shareholders. A three-year growth rate of 2.21% alongside a five-year growth rate of 7.49% confirms moderate yet consistent growth.
| Time | Growth |
|---|---|
| 3 years | 2.21% |
| 5 years | 7.49% |
The average dividend growth is 7.49% over 5 years. This shows moderate but steady dividend growth.
✅ Payout Ratio
The payout ratio is a significant metric indicating how well earnings cover dividend payments. A balanced EPS-based payout ratio of 58.21% and a higher FCF-based ratio of 82.21% show the dividends are supported but indicate limited room for growth without increased earnings.
| Key figure | Ratio |
|---|---|
| EPS-based | 58.21% |
| Free cash flow-based | 82.21% |
The EPS payout ratio signifies a cautious dividend policy, whereas the higher FCF-based ratio suggests that while dividends are well-covered, future increases may depend heavily on cash flow improvements.
⚖️ Cashflow & Capital Efficiency
Cash flow and capital efficiency metrics underscore the company's operational health and capital management, informing its sustainable dividend-paying capability.
| Metric | 2023 | 2024 | 2025 |
|---|---|---|---|
| Free Cash Flow Yield | 3.15% | 3.06% | - |
| Earnings Yield | 4.54% | 4.14% | 3.34% |
| CAPEX to Operating Cash Flow | 8.26% | 5.15% | - |
| Stock-based Compensation to Revenue | 3.53% | 3.69% | - |
| Free Cash Flow / Operating Cash Flow Ratio | 91.74% | 94.85% | - |
The company's operational efficiency is reflected in its stable free cash flow yield and favorable earnings yield. It highlights the robust cash flow management, crucial for sustaining dividend payouts.
🔍 Balance Sheet & Leverage Analysis
Analyzing leverage and financial ratios offers insight into the company's ability to handle its debts whilst remaining solvent and financially secure.
| Metric | 2023 | 2024 | 2025 |
|---|---|---|---|
| Debt-to-Equity | 24.66% | 29.94% | - |
| Debt-to-Assets | 7.87% | 10.26% | - |
| Debt-to-Capital | 19.78% | 23.04% | - |
| Net Debt to EBITDA | 14.26% | 17.79% | - |
| Current Ratio | 15.63 | - | - |
| Quick Ratio | 15.63 | 16.40 | - |
| Financial Leverage | 3.13 | 2.92 | - |
The substantial current and quick ratios show that BlackRock possesses strong liquidity, assuring creditors of timely payments, showcasing excellent financial stability.
📈 Fundamental Strength & Profitability
Profitability metrics are crucial for assessing how effectively a company utilizes resources to maximize earnings relative to other entities within its industry.
| Metric | 2023 | 2024 | 2025 |
|---|---|---|---|
| Return on Equity | 13.98% | 13.41% | - |
| Return on Assets | 4.47% | 4.59% | - |
| Margins: Net | 30.81% | 31.21% | 22.93% |
| Margins: EBIT | 35.53% | 37.62% | 32.25% |
| Margins: EBITDA | 37.92% | 40.22% | 34.99% |
| Margins: Gross | 48.05% | 49.42% | 55.52% |
| R&D to Revenue | 3.40% | 3.30% | - |
Strong return metrics and substantial net margins illustrate BlackRock's ability to efficiently generate profits from its equity base and operational activities.
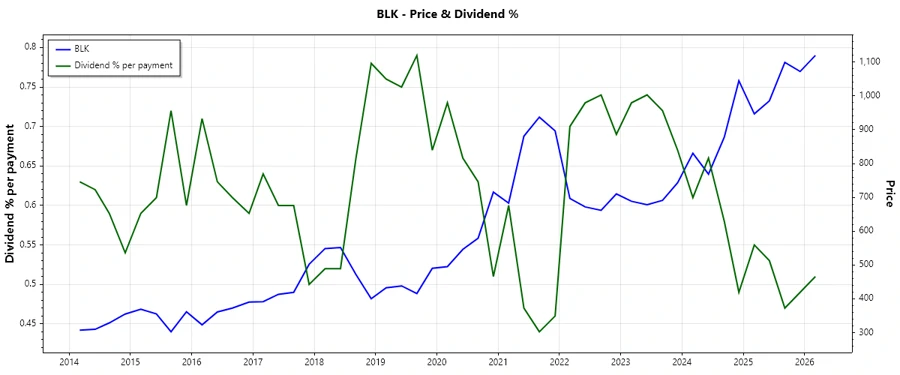
📉 Price Development
🎯 Dividend Scoring System
| Criteria | Score | Score Bar |
|---|---|---|
| Dividend yield | 4 | |
| Dividend Stability | 5 | |
| Dividend Growth | 3 | |
| Payout ratio | 3 | |
| Financial Stability | 5 | |
| Dividend Continuity | 5 | |
| Cashflow Coverage | 4 | |
| Balance Sheet Quality | 5 |
Total Score: 34/40
⭐ Rating
BlackRock, Inc. is a strong dividend-paying stock for long-term investors seeking stable income with manageable growth prospects. Its balance sheet quality and dividend stability make it a reliable choice, although investors should monitor payout ratios closely.
Smart Data Insight
Master the Perfect Entry & Exit for this Stock
Don't leave your profits to chance. Historically, this stock follows specific seasonal patterns that institutional traders use to maximize returns.
- ✅ Identify the "Golden Buying Window"
- ✅ Avoid high-risk correction cycles
- ✅ Backtested data from the last 20+ years