February 12, 2026 a 08:15 am
BLDR: Trend and Support & Resistance Analysis - Builders FirstSource, Inc.
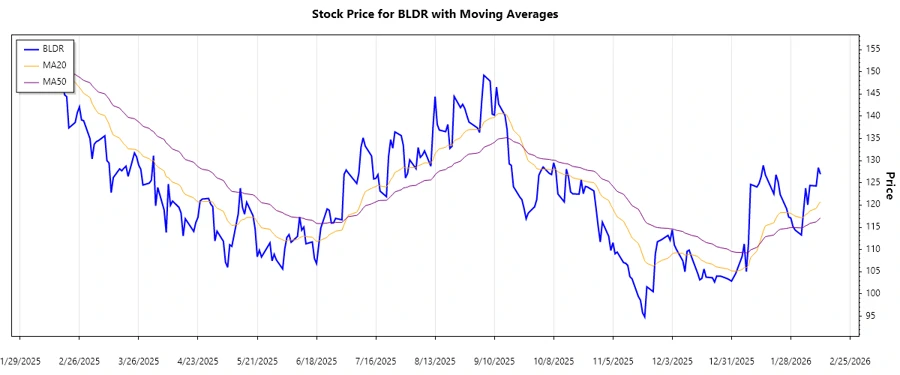
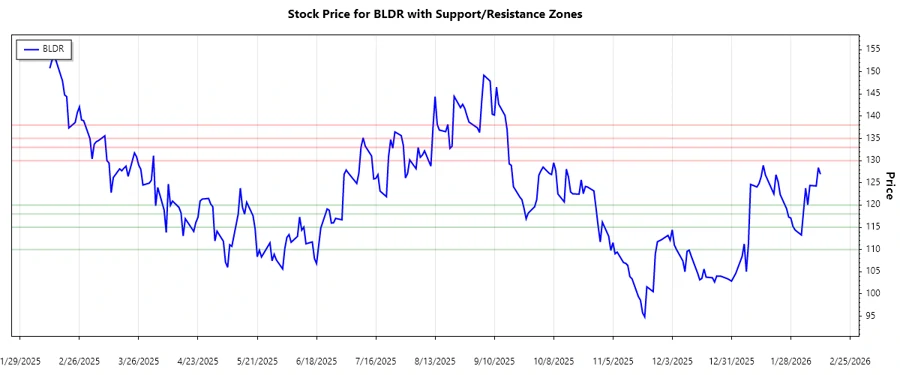
The stock of Builders FirstSource, Inc. (BLDR), showcased a mixed performance in recent months, marked by volatility. Analyzing the available data highlights a recent uptrend as the stock price has risen from its lows in January. The technical indicators, including the EMA analysis, support this upward shift. Understanding the support and resistance zones can be crucial in predicting further movements.
Trend Analysis
Builders FirstSource, Inc. has recently shown an upward momentum. The EMA20 and EMA50 analysis confirms a continued uptrend, as the EMA20 line has consistently remained above the EMA50. This indicator suggests a bullish outlook for the stock.
| Date | Closing Price | Trend |
|---|---|---|
| 2026-02-11 | $126.94 | ▲ Up |
| 2026-02-10 | $128.42 | ▲ Up |
| 2026-02-09 | $124.30 | ▲ Up |
| 2026-02-06 | $124.42 | ▲ Up |
| 2026-02-05 | $120.06 | ▲ Up |
| 2026-02-04 | $123.80 | ▲ Up |
| 2026-02-03 | $118.56 | ▲ Up |
The sustained uptrend, confirmed by EMA analysis, suggests a positive outlook. Investors may anticipate continued growth if these technical patterns persist.
Support and Resistance
Based on the closing prices, two primary support zones and resistance zones have been identified. These zones will be pivotal in predicting the stock's potential breakout points.
| Zone Type | Price Range |
|---|---|
| Support 1 | ▼ $110.00 - $115.00 |
| Support 2 | ▼ $118.00 - $120.00 |
| Resistance 1 | ▲ $130.00 - $133.00 |
| Resistance 2 | ▲ $135.00 - $138.00 |
Currently, the stock is navigating near the upper resistance levels. Breaking through these could suggest further upward potential.
Conclusion
In conclusion, Builders FirstSource, Inc. is currently experiencing an upward trend. The EMAs indicate bullish momentum, while the support and resistance levels provide crucial insights into potential breakout zones. The stock is trading close to its resistance levels, indicating potential future growth if these thresholds are surpassed. However, any decline beneath the support zones might prompt a reassessment of the stock's current run.