October 02, 2025 a 06:45 am
BLDR: Fibonacci Analysis - Builders FirstSource, Inc.
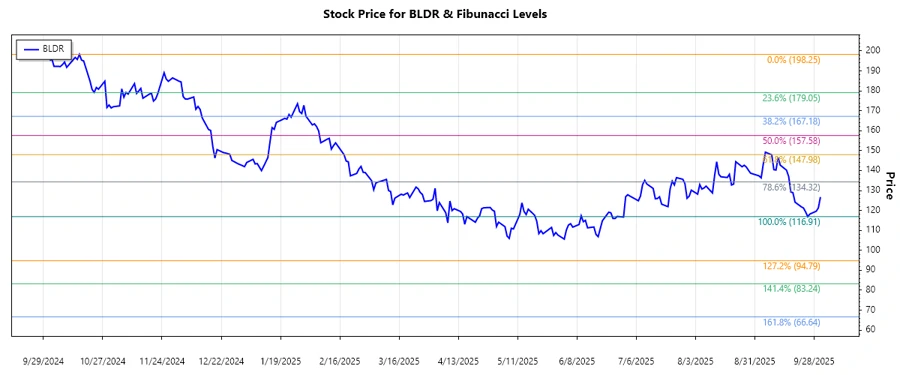
Builders FirstSource, Inc. is currently experiencing a downtrend, with a significant decline in its stock price over several months. As a major supplier of building materials and solutions in the US, downturns in the housing market or construction industry can affect its stock performance. The recent analysis indicates the stock might be resting around a potential support zone, offering an opportunity for cautious investors.
Fibonacci Analysis
A detailed technical analysis of Builders FirstSource, Inc. (BLDR) shows a downtrend beginning in October 2024 and continuing into October 2025. During this period, the highest point recorded was $198.25 on October 16, 2024, and the lowest was $116.91 on September 25, 2025.
| Information | Details |
|---|---|
| Start Date | 2024-10-02 |
| End Date | 2025-10-01 |
| High Point | $198.25 on 2024-10-16 |
| Low Point | $116.91 on 2025-09-25 |
| Fibonacci Level | Price Level |
|---|---|
| 0.236 | $153.07 |
| 0.382 | $170.31 |
| 0.5 | $179.86 |
| 0.618 | $189.41 |
| 0.786 | $202.04 |
The current price of $126.74 indicates that the stock is currently below the 0.236 retracement level, potentially highlighting a bearish sentiment. This level may act as a resistance if the price attempts to move higher.
Conclusion
The analysis of Builders FirstSource, Inc. suggests caution as the stock is in a prolonged downtrend. While potential support zones exist at Fibonacci levels, the current market sentiment remains bearish. Investors should consider external factors such as housing market dynamics. However, for value investors, current price levels might present a discounted entry point, although with inherent risks. A potential upside exists if the price rallies back to higher Fibonacci levels, but vigilance is advised given the prevailing trend.
JSON representation:
Smart Data Insight
Master the Perfect Entry & Exit for this Stock
Don't leave your profits to chance. Historically, this stock follows specific seasonal patterns that institutional traders use to maximize returns.
- ✅ Identify the "Golden Buying Window"
- ✅ Avoid high-risk correction cycles
- ✅ Backtested data from the last 20+ years