March 20, 2026 a 04:44 pm
BK: Fibonacci Analysis - The Bank of New York Mellon Corporation
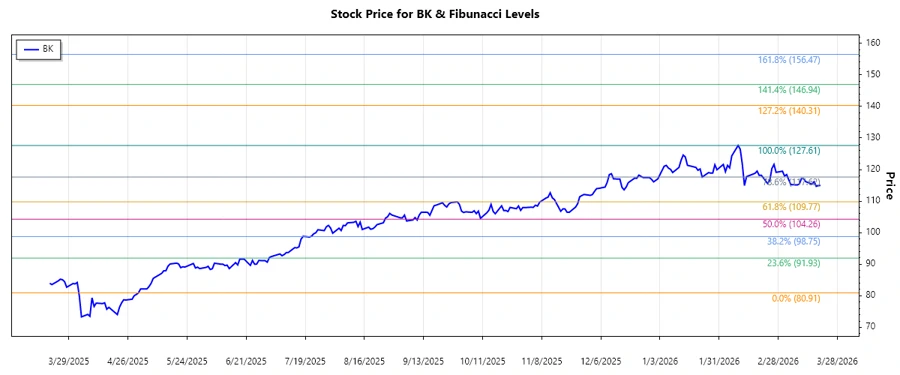
The Bank of New York Mellon Corporation (BK) has experienced a significant upward trend in the past few months. Investors and analysts are closely monitoring this movement, utilizing technical indicators such as Fibonacci Retracement to forecast potential support and resistance levels. Given BK's diverse range of financial services, its stock performance can be indicative of broader market sentiment, especially within the financial sector.
Fibonacci Analysis
| Aspect | Details |
|---|---|
| Trend Start Date | 2025-07-15 |
| Trend End Date | 2026-03-20 |
| Highest Price | $127.61 on 2026-02-09 |
| Lowest Price | $80.91 on 2025-05-01 |
| Fibonacci Retracement Levels | |
| 0.236 Level | $97.56 |
| 0.382 Level | $105.67 |
| 0.5 Level | $114.26 |
| 0.618 Level | $122.85 |
| 0.786 Level | $126.10 |
| Current Price Position | The current price is within the 0.5 retracement level ($114.95). |
| Technical Interpretation | The 0.5 Fibonacci level could act as a significant support level if the price remains above it, indicating potential for future upward momentum. |
Conclusion
The Bank of New York Mellon Corporation's stock has experienced a notable ascent with key Fibonacci retracement levels acting as potential support or resistance. While the current price hovers around the 0.5 retracement level, this may offer a strong foundation if maintained. However, should the price drop below this level, it might test lower support levels. The existing upward trend provides optimistic opportunities for investors, but caution is warranted regarding potential macroeconomic impacts or sector-specific challenges.